Bitcoin Breaks Above $91K as Risk Appetite Rebounds Amid Geopolitical Noise - Jan 4, 2026
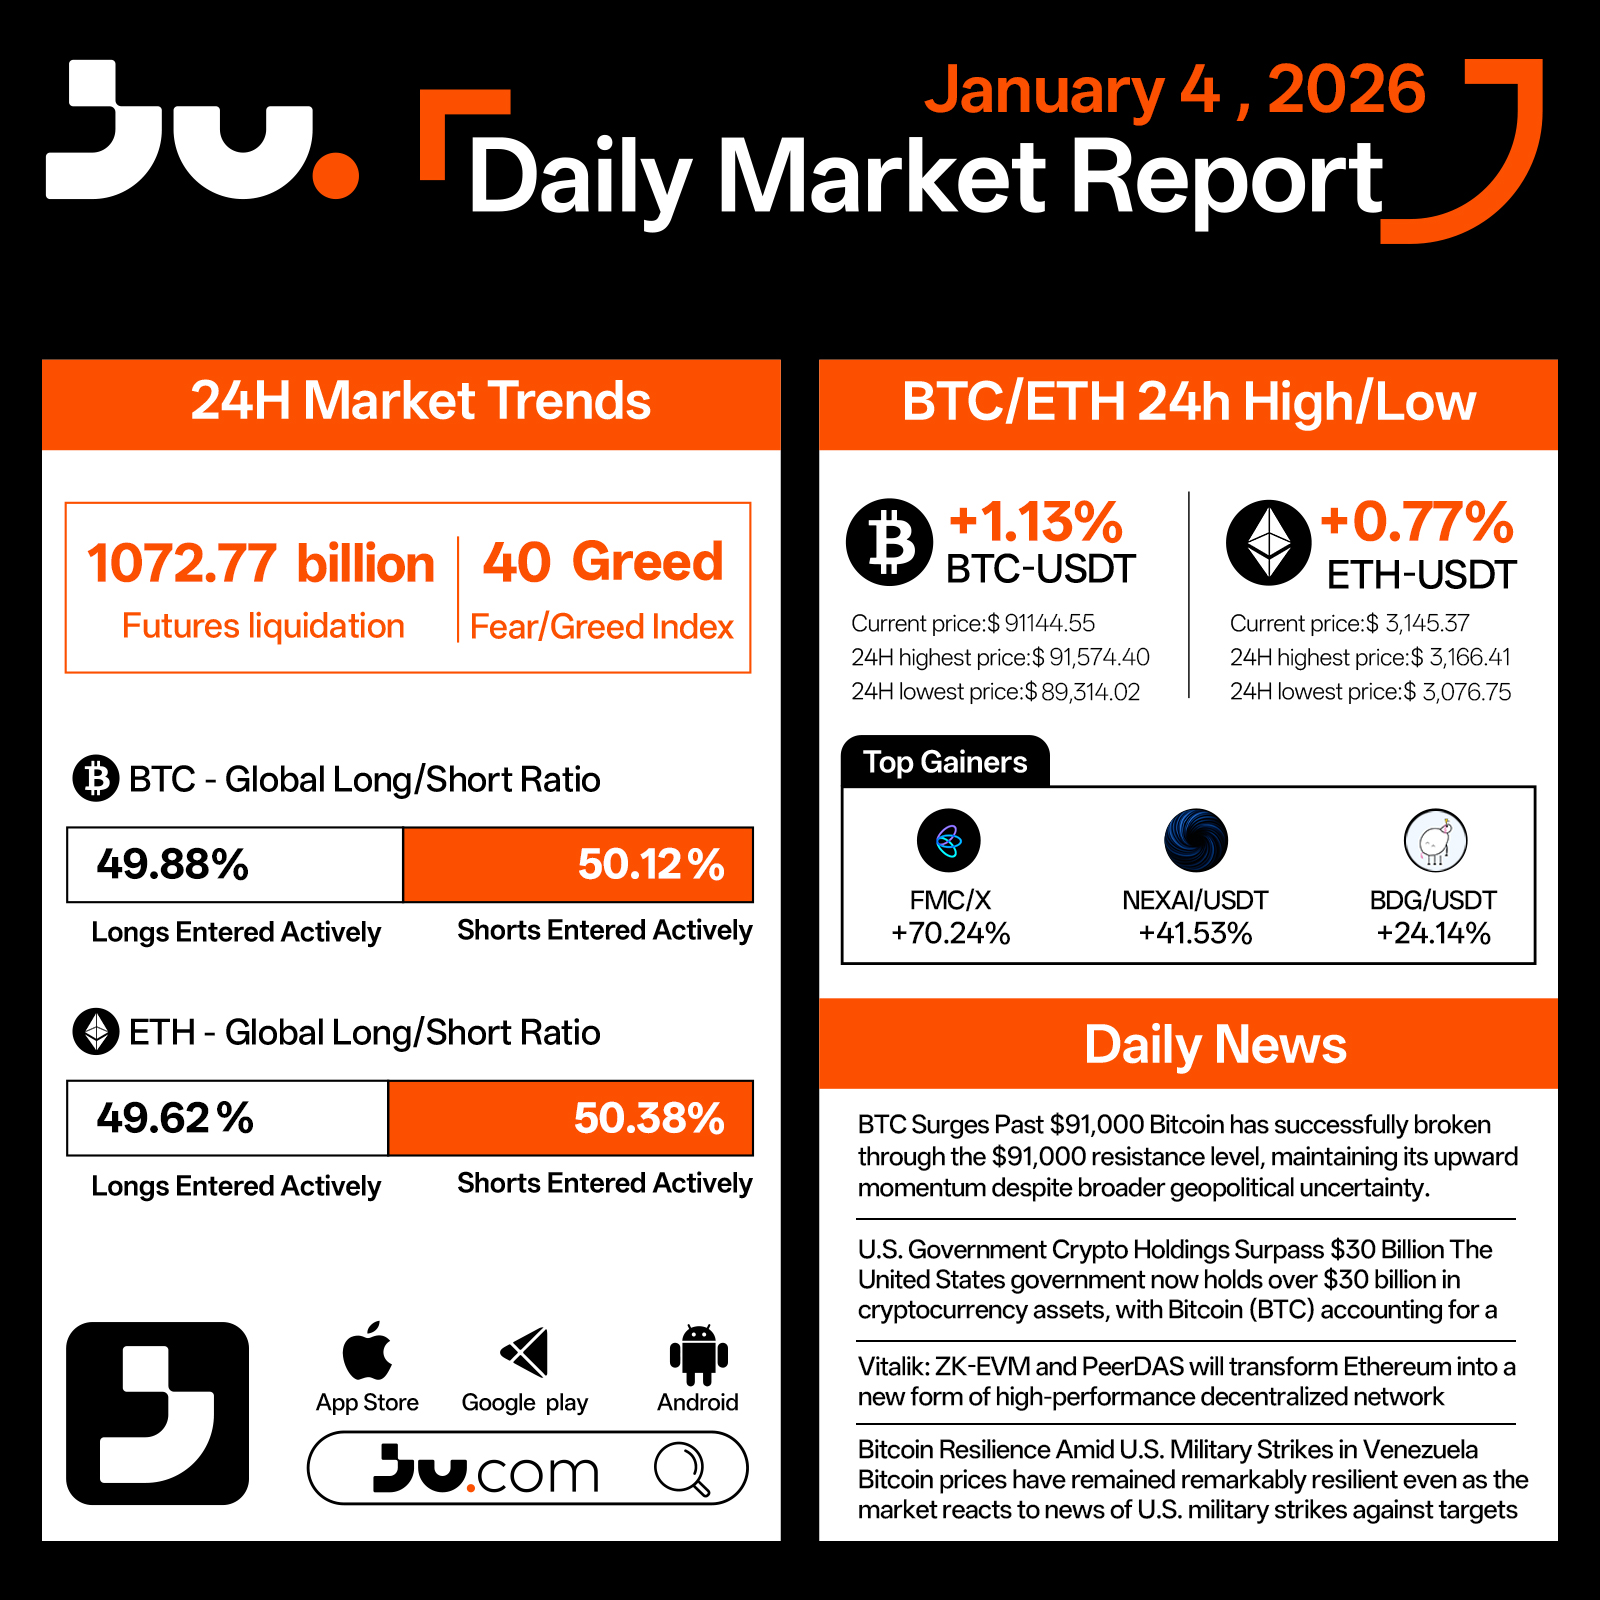
On January 4, the crypto market carried forward its early-year momentum, with Bitcoin decisively breaking through a key resistance level and lifting overall sentiment. Over the past 24 hours, market activity expanded notably, with total turnover and liquidations reaching $107.27 billion, while the Fear & Greed Index climbed to 40, signaling a clear rebound in risk appetite compared with year-end conditions.
Bitcoin rose 1.13% to $91,144.55, posting an intraday high of $91,574.40 and a low of $89,314.02. The successful break above the $91,000 level and subsequent consolidation suggest sustained bullish momentum. Ethereum followed with a 0.77% gain to $3,145.37, trading within a $3,166.41–$3,076.75 range and maintaining a steady correlation with BTC’s upward move. Positioning remained balanced, with BTC longs at 49.88% and ETH longs at 49.62%, indicating that the advance has been driven more by spot demand and trend-following capital than by excessive leverage.
Structural opportunities remained active across smaller-cap assets. FMC/X surged 70.24%, while NEXAI/USDT and PIPPIN/USDT advanced 41.53% and 24.14%, respectively. These moves reflect selective capital rotation as traders respond to Bitcoin’s breakout without broad-based risk expansion.
Macro and fundamental signals added depth to the move. The U.S. government disclosed that its cryptocurrency holdings now exceed $30 billion, with Bitcoin accounting for 97% of the total, reinforcing BTC’s status as the dominant digital reserve asset. On the Ethereum front, Vitalik Buterin stated that ZK-EVM and PeerDAS will transform Ethereum into a new form of high-performance decentralized network, strengthening long-term scalability and data availability narratives. Despite heightened geopolitical headlines, including reports of U.S. military strikes in Venezuela, Bitcoin prices remained resilient, underscoring its growing role as an asset capable of withstanding external shocks.
Overall, the opening days of 2026 show a market regaining directional clarity. Bitcoin’s breakout provides a clear technical anchor, while Ethereum’s roadmap supports medium-term confidence. With liquidity and sentiment improving in tandem, the crypto market appears to be entering the early phase of a new structural advance.
#cryptocurrency #blockchain


JU Blog
2026-01-07 03:12
Bitcoin Breaks Above $91K as Risk Appetite Rebounds Amid Geopolitical Noise - Jan 4, 2026
Disclaimer:Contains third-party content. Not financial advice.
See Terms and Conditions.
On January 4, the crypto market carried forward its early-year momentum, with Bitcoin decisively breaking through a key resistance level and lifting overall sentiment. Over the past 24 hours, market activity expanded notably, with total turnover and liquidations reaching $107.27 billion, while the Fear & Greed Index climbed to 40, signaling a clear rebound in risk appetite compared with year-end conditions.
Bitcoin rose 1.13% to $91,144.55, posting an intraday high of $91,574.40 and a low of $89,314.02. The successful break above the $91,000 level and subsequent consolidation suggest sustained bullish momentum. Ethereum followed with a 0.77% gain to $3,145.37, trading within a $3,166.41–$3,076.75 range and maintaining a steady correlation with BTC’s upward move. Positioning remained balanced, with BTC longs at 49.88% and ETH longs at 49.62%, indicating that the advance has been driven more by spot demand and trend-following capital than by excessive leverage.
Structural opportunities remained active across smaller-cap assets. FMC/X surged 70.24%, while NEXAI/USDT and PIPPIN/USDT advanced 41.53% and 24.14%, respectively. These moves reflect selective capital rotation as traders respond to Bitcoin’s breakout without broad-based risk expansion.
Macro and fundamental signals added depth to the move. The U.S. government disclosed that its cryptocurrency holdings now exceed $30 billion, with Bitcoin accounting for 97% of the total, reinforcing BTC’s status as the dominant digital reserve asset. On the Ethereum front, Vitalik Buterin stated that ZK-EVM and PeerDAS will transform Ethereum into a new form of high-performance decentralized network, strengthening long-term scalability and data availability narratives. Despite heightened geopolitical headlines, including reports of U.S. military strikes in Venezuela, Bitcoin prices remained resilient, underscoring its growing role as an asset capable of withstanding external shocks.
Overall, the opening days of 2026 show a market regaining directional clarity. Bitcoin’s breakout provides a clear technical anchor, while Ethereum’s roadmap supports medium-term confidence. With liquidity and sentiment improving in tandem, the crypto market appears to be entering the early phase of a new structural advance.
#cryptocurrency #blockchain
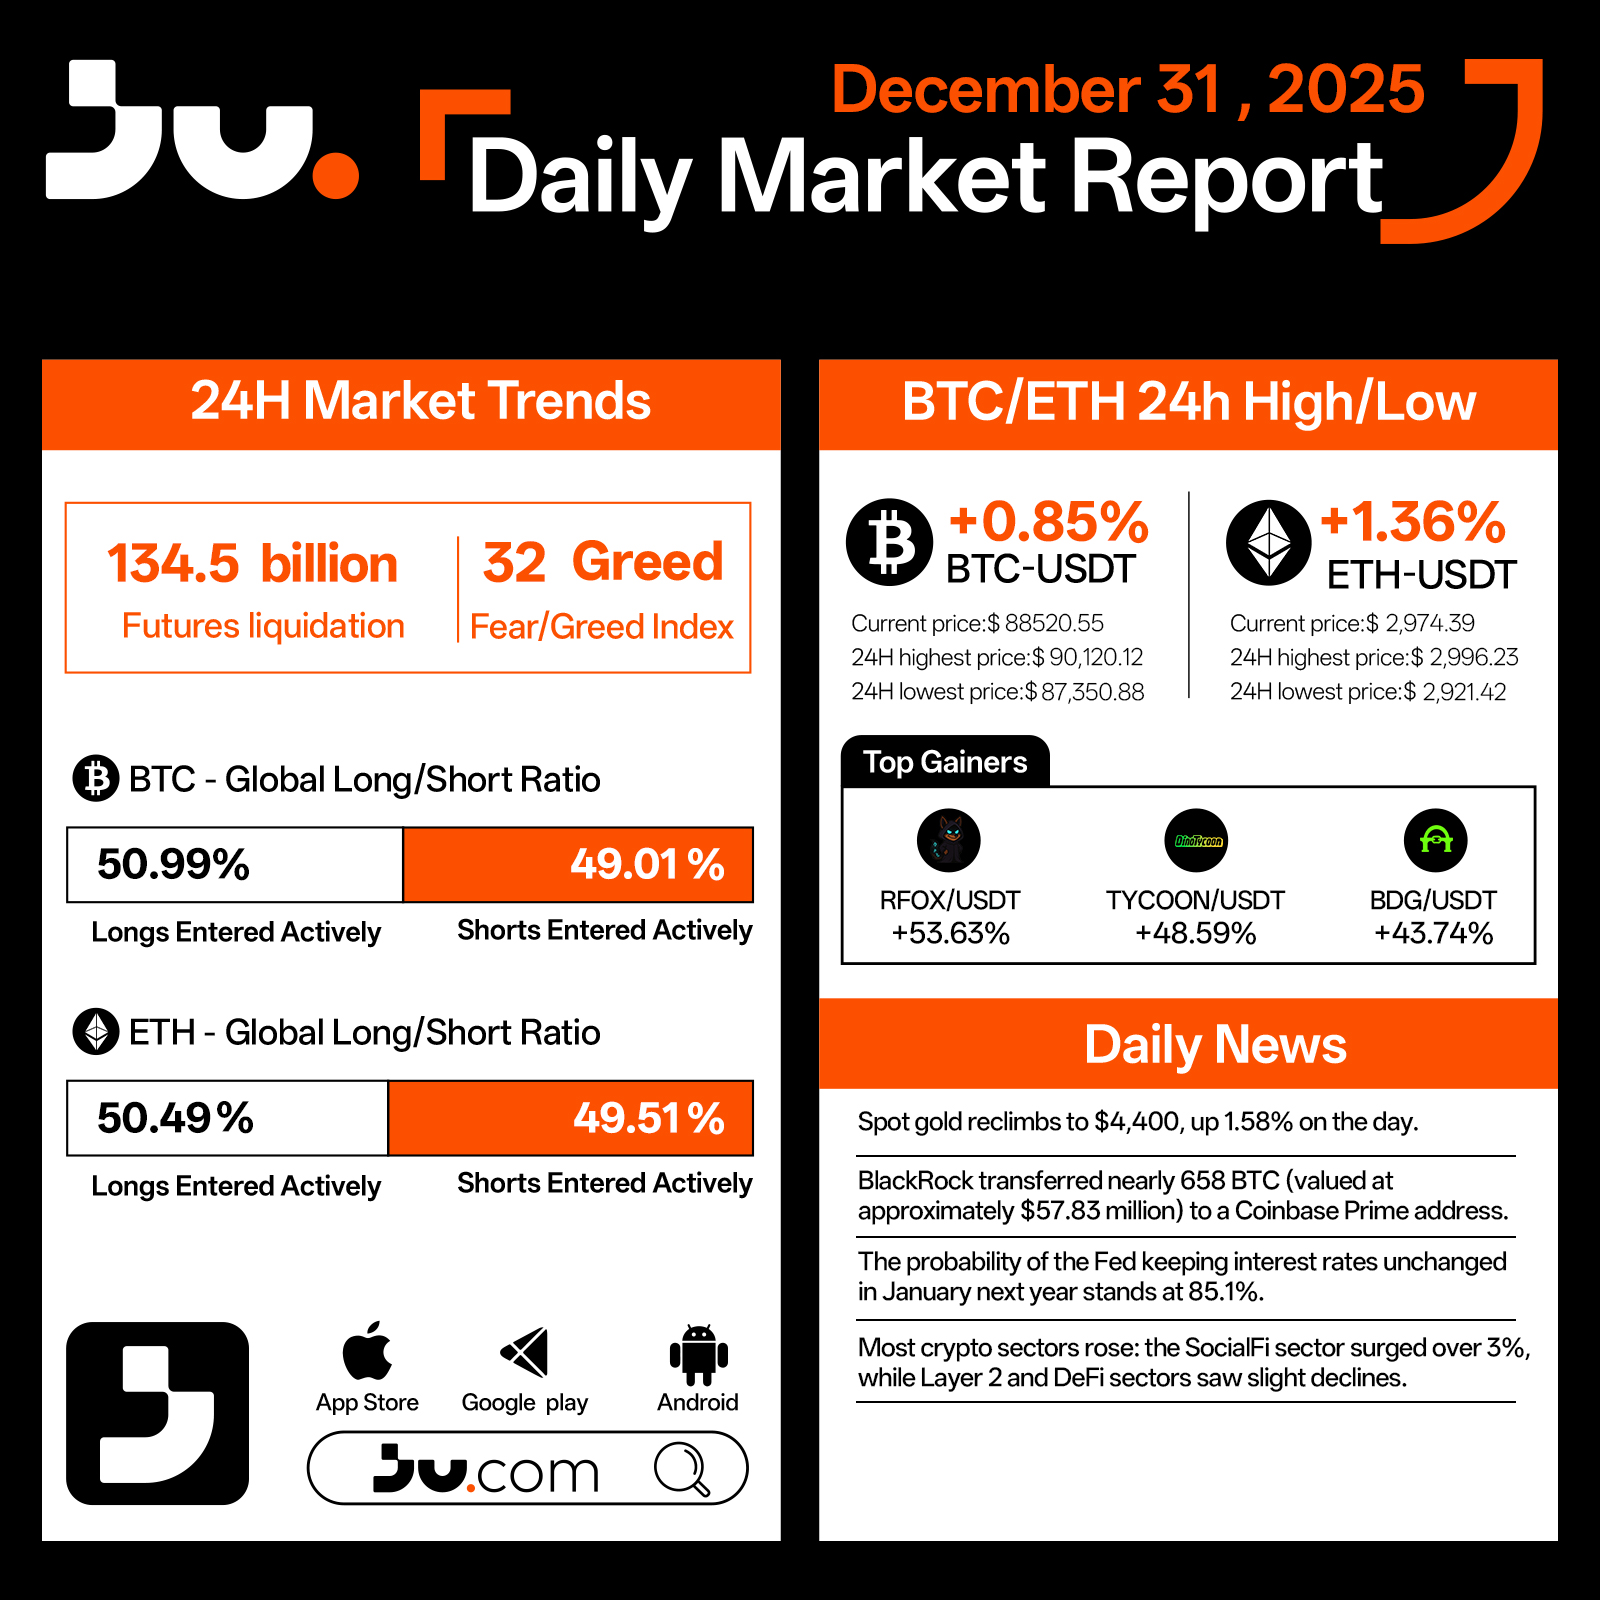
On December 31, crypto markets closed out 2025 with a modest recovery, as major assets rebounded and overall sentiment improved into year-end. Total liquidations over the past 24 hours rose to $134.5 billion, reflecting continued position adjustments as investors rebalanced exposure. The Fear & Greed Index climbed to 32, marking a recent high and signaling a gradual return of risk appetite following prior volatility.
Bitcoin gained 0.85% to $88,520.55, trading within an intraday range of $90,120.12 to $87,350.88, maintaining a constructive consolidation pattern. Ethereum showed comparatively steadier strength, rising 1.36% to $2,974.39, with prices holding between $2,996.23 and $2,921.42, preserving key support levels into the close of the year. Positioning data reflected a slight bullish bias, with BTC longs at 50.99% and ETH longs at 50.49%, though overall market conviction remains measured rather than decisive.
Structural activity remained active beneath the surface. RFOX/USDT advanced 53.63%, while TYCOON/USDT and BDG/USDT posted gains of 48.59% and 43.74%, respectively. Sector performance was broadly positive, led by the SocialFi segment, which rose more than 3%, while Layer 2 and DeFi sectors saw mild pullbacks. The rotation highlights continued selectivity as capital favors narrative-driven opportunities over broad-based exposure.
From a macro and institutional perspective, safe-haven assets also rebounded. Spot gold reclaimed the $4,400/oz level, gaining 1.58% on the day, underscoring persistent demand for inflation and uncertainty hedges. On-chain flows drew attention as BlackRock transferred nearly 658 BTC, valued at approximately $57.83 million, to a Coinbase Prime address, fueling speculation around institutional custody and portfolio management activity. Interest-rate expectations remained supportive, with the probability of the Federal Reserve holding rates steady in January 2026 rising to 85.1%, providing a relatively stable macro backdrop for risk assets.
Overall, the final trading session of 2025 reflects a market ending the year on a steadier footing, characterized by recovering prices, improving sentiment, and ongoing structural divergence. While no single narrative dominated year-end trading, the groundwork appears set for more differentiated, theme-driven market behavior as crypto enters 2026 under clearer macro and institutional conditions.
#cryptocurrency #blockchain #finance
Bitcoin bags are getting blown out today, as the price of BTC falls to nearly $80,000 and marks a new seven-month low.
- The continued downward pressure on its price has pushed Bitcoin into a so-called death cross—when the average price of an asset over the short term falls below the average price over the long term. It’s a technical pattern that typically signals extended bearish momentum. For traders who study charts, it confirms what permabulls don’t want to hear: It’s over—at least for now.
- It’s happening as the crypto market as a whole shrinks to $2.91 trillion, shedding nearly $60 billion in the past 24 hours alone. Almost every single coin in the top 100 by market cap is bleeding red.
- The Fear and Greed Index, which measures market sentiment on a scale from 0 to 100, has cratered to 14 points—just four points above the year's low of 10 back in February. When this index drops below 20, it signals "extreme fear," and right now, traders are absolutely terrified.
- But it's not just crypto drama driving the market selloff. The macro picture is turning nasty. Just weeks ago, markets were pricing in a 97% chance the Federal Reserve would cut interest rates in December. Now? Those odds have collapsed to somewhere between 22% and 43%, depending on which metric you check.
- Fed officials are openly divided, with many signaling they'd prefer to keep rates unchanged through year-end. For risk assets like crypto that thrive on easy money, this is poison.
- On Myriad, a prediction market developed by Decrypt’s parent company Dastan, traders are now overwhelmingly convinced that Bitcoin will not mark a new all-time high this year, placing odds at almost 90% that BTC will not top the $126K mark that it hit on October 6.
- The bearish vibes are so strong, Myriad traders also currently place 40% odds that Bitcoin falls as low as $69K. So how low will it go? Here’s what the charts say.
- Bitcoin opened today at $86,691 and immediately sold off, hitting an intraday low of $80,620 before bouncing slightly to its current price at $85,187. That's a 1.61% drop on the day after being almost 5% down over the last 24 hours. More importantly, for traders, it further confirms the death cross pattern that's been progressively forming since its all-time high in early October. The death cross pattern was first confirmed on Wednesday as Bitcoin slid to around $88,000—now it’s fallen deeper.
- Here's what's happening on the charts: Exponential Moving Averages, or EMAs, help traders identify trend direction by tracking the average price of an asset over the short, medium, and long term. When the short-term 50-day EMA falls below the longer-term 200-day EMA, it means bears are in control and the longer-term bull market structure has been broken.
- For Bitcoin, the 50-day EMA has now decisively crossed below the 200-day EMA. In short, this tells traders market momentum has shifted from bullish to bearish. The gap between both EMAs increases the more the price of BTC trades below those targets—and the bigger the gap, the stronger the trend.
- The price of Bitcoin is now trading well below both EMAs, which creates a situation where each bounce attempt faces immediate resistance, increasing the gap between the two EMAs, making the bearish trend even stronger. Bulls trying to push higher will need to first reclaim the 50-day EMA, then tackle the 200-day—a double wall of resistance that's historically tough to crack in one go.
- As for other technical indicators, the Average Directional Index, or ADX, sits at 41, which is considered "strong." ADX measures trend strength regardless of direction, with readings above 25 indicating a clear trend is in place. At 41, this tells us we’re not seeing just a minor correction, but a potentially extended move lower.
- The Relative Strength Index, or RSI, has plunged to 23.18, placing Bitcoin deep in oversold territory. RSI measures momentum on a scale from 0 to 100, with readings below 30 signaling oversold conditions where assets are potentially undervalued. However, "oversold" doesn't mean the selling has to stop—in strong downtrends, RSI can remain in oversold territory for extended periods as prices continue grinding lower. But, yes, this also provides hopium for momentum traders as it signals that the worst of it may be over. (The worst being an accelerated crash, not necessarily a steady drop.)
- The Squeeze Momentum Indicator is flashing "bearish impulse," meaning selling pressure is intensifying rather than easing. Meanwhile, the Volume Profile Visible Range (VPVP) shows the price of Bitcoin trading "below" key volume nodes, suggesting there's not much buying interest at current levels.
- So, everything is bearish, clearly. But where's the next support? How low can the price of BTC go? The chart reveals several key horizontal levels to watch.
- The immediate danger zone is $80,697, which briefly held today but looked shaky. If that breaks, the next major support sits at $74,555, followed by $65,727, and potentially all the way down to $53,059 if panic really sets in during a crypto winter. Those price levels have previous consolidation zones where significant trading volume accumulated, making them natural landing spots for oversold bounces.
- For resistances, traders will watch for BTC’s price breaking past $90,000 again and look at $100,000 as the major psychological target.
- Ethereum opened at $2,830.7 and dropped as low as $2,621 intraday before stabilizing around $2,798—a 1.16% loss on the day. While not as dramatic as Bitcoin's selloff, ETH's technical picture is equally concerning.
- Unlike Bitcoin, Ethereum hasn't fully confirmed its death cross yet—the 50-day EMA is still technically above the 200-day, giving it a "long" signal on an indicator that is obviously hours away from changing to bearish. The gap is razor-thin and closing fast. More importantly, ETH’s price is trading well below both EMAs, rendering that technical distinction somewhat meaningless. The bearish momentum is clearly established.
- A good way to see the natural support zones is using the Fibonacci retracements: a set of natural clusters that appear during a trend, showing supports and resistances in a specific timeframe—not because of price, but because of natural proportions.
- Right now, ETH is testing the 0.618 Fibonacci level at approximately $2,755. If this level breaks, the next Fibonacci support doesn't appear until $2,180, which would represent a massive 22% drop from current prices, and would resolve a price market on Myriad betting on ETH’s moon or doom.
- The ADX for Ethereum is even stronger than Bitcoin's at 46, indicating the downtrend is rock-solid. Meanwhile, RSI sits at 28.46—not quite as oversold as Bitcoin but definitely in stressed territory. The Squeeze Momentum Indicator shows "bearish impulse" here too, confirming sellers are in control.
- XRP is showing relative strength compared to its larger peers, down just 0.50% to close at $1.98 after opening at $1.99 and hitting an intraday low of $1.81796. Don't let that modest percentage fool you though—the technical damage is real.
- Like Bitcoin, the Ripple-linked XRP has confirmed a full death cross with its 50-day EMA now below the 200-day. The price of XRP is trading beneath both EMAs, and with an ADX of 32, the downtrend has enough strength to continue. While 32 isn't as extreme as Bitcoin's 41 or Ethereum's 46, it's still well above the 25 threshold that confirms a trend is in place rather than just random chop.
- The RSI at 32.86 shows XRP is approaching oversold territory but hasn't quite reached the extreme stress levels of Bitcoin and Ethereum. This could mean two things: either XRP has more downside before finding equilibrium, or it's showing genuine relative strength that could make it a safer harbor if the broader market continues tanking.
- XRP had such a crazy year that its price action shows only two major horizontal support levels that should concern XRP holders—and that would be very painful for hodlers, considering the movement from the all-time high to those targets.
- The next major support zone sits at $1.589, which represents a potential 20% drop from current levels. If that breaks, there's very little support until $0.66, a catastrophic 67% plunge from current prices and almost 80% from all-time high zone that would take XRP back to early 2024 levels.
The Squeeze Momentum Indicator is showing "bearish impulse," and like the other coins, the volume profile indicates XRP’s price is trading below key volume levels, meaning there's not much buying interest stepping in to defend current prices.
#Bitcoin #BitcoinDeathCross #Jucom #cryptocurrency #blockchain $BTC/USDT $JU/USDT $ETH/USDT
The price of Cardano (ADA) was down on Friday after the blockchain suffered an unexpected chain split, which was caused by a malformed delegation transaction that triggered a software flaw. That created problems for Cardano users, and prompted a public apology from the user who claimed that they caused it.
- Intersect, the Cardano ecosystem’s governance organization, said in an incident report that the divergence began when the malformed transaction passed validation on newer node versions, but nodes running older software rejected it.
- “This exploited a bug in an underlying software library that was not trapped by validation code,” Intersect wrote. “The execution of this transaction caused a divergence in the blockchain, effectively splitting the network into two distinct chains: one containing the ‘poisoned’ transaction and a ‘healthy’ chain without it.”
- Earlier that day, Cardano co-founder Charles Hoskinson posted on X that it was a “premeditated attack from a disgruntled [stake pool operator]” who was “actively looking at ways to harm the brand and reputation of [Cardano developer Input/Output Global].”
- According to Hoskinson, all Cardano users were impacted. The price of Cardano’s token ADA was down more than 6% recently, following the incident.
- According to the incident report, the mismatch caused operators to build blocks on different branches of the chain until patched node software was deployed. Developers and service providers coordinated an emergency response, and operators were urged to upgrade to rejoin the main chain.
- Intersect said the wallet responsible for the malformed transaction has been identified, while Hoskinson said it will take weeks to clean up the mess.
- “Forensic analysis suggests links to a participant from the Incentivized Testnet (ITN) era,” Intersect wrote. “As this incident constitutes a potential cyberattack on a digital network, relevant authorities, including the Federal Bureau of Investigation, are being engaged to investigate.”
- Hours after the incident, an X user posting under the name Homer J. said they were responsible for submitting the transaction that triggered the split.
- “Sorry Cardano folks, it was me who endangered the network with my careless action yesterday evening,” they wrote, describing the attempt as a personal challenge to reproduce the “bad transaction” and said he relied on AI-generated instructions while blocking traffic on their server.
- “I've felt awful as soon as I realized the scale of what I've caused. I know there's nothing I can do to make up for all the pain and stress I've caused over the past X hours,” they added. “Difficult to quantify the negligence on my behalf. I am sorry, I truly am. I didn't have evil intentions.”
- Homer wrote that he did not sell or short ADA, did not coordinate with anyone else, and did not act for financial gain. “I'm ashamed of my carelessness and take full responsibility for it and whatever consequences will follow,” he said.
- According to Intersect, no user funds were lost, and most retail wallets were unaffected because they were running node components that handled the malformed transaction safely.
- Hoskinson, the outspoken co-founder of Cardano, claimed in a video message that the network “didn’t go down,” though users did encounter issues before the problem was fixed.
“It is important to note that the network did not stall. Block production continued on both chains throughout the incident, and at least some identical transactions appeared on both chains,” Intersect wrote. “However, to ensure the integrity of the ledger, exchanges and third-party providers largely paused deposits and withdrawals as a precautionary measure.”
#Cardano #CardanoNetwork #Jucom #cryptocurrency #blockchain $ADA/USDT $JU/USDT $BTC/USDT
What Is the Total Number of Transactions on the Bitcoin Network?
Understanding the total number of transactions on the Bitcoin network is essential for grasping how active and widely used this pioneering cryptocurrency truly is. This metric offers insights into user engagement, network health, and overall adoption trends. In this article, we will explore what influences transaction volume, recent developments in 2023, and what these figures mean for investors and users alike.
How Does Transaction Volume Reflect Network Activity?
The total number of Bitcoin transactions indicates how frequently users are transferring funds or engaging with blockchain-based applications. On average, as of 2023, around 250,000 to 300,000 transactions occur daily. These fluctuations are driven by various factors such as market sentiment—bullish periods tend to see increased activity—as well as regulatory environments that can either encourage or restrict usage.
High transaction volumes suggest a vibrant ecosystem where users actively buy, sell, or transfer Bitcoin. Conversely, dips may signal reduced interest or external pressures like stricter regulations. Monitoring these numbers helps stakeholders gauge whether Bitcoin remains a popular medium for peer-to-peer payments or speculative trading.
Factors Influencing Transaction Counts
Several key elements impact how many transactions are recorded on the blockchain:
- Market Conditions: Bull markets often lead to increased trading activity as investors seek opportunities.
- Regulatory Changes: Stricter laws can temporarily suppress transaction volumes; conversely, favorable policies may boost activity.
- Network Congestion: When many users transact simultaneously—such as during major price swings—transaction fees rise due to limited block space.
- Technological Developments: Improvements like SegWit (Segregated Witness) have optimized transaction processing times and costs over time.
These factors collectively shape daily transaction counts and influence user behavior across different periods.
Recent Trends in 2023: Fluctuations in Transaction Numbers
In April 2023, the Bitcoin network experienced a notable surge in transaction volume driven by heightened market speculation amid potential regulatory shifts in major economies. This increase was partly fueled by traders reacting to news about possible government interventions that could impact cryptocurrency markets globally.
However, May saw an uptick in average transaction fees—about a 20% rise compared to previous months—which reflects higher network congestion. Elevated fees can discourage smaller transactions from occurring frequently because they become less cost-effective for everyday use cases like micro-payments or casual transfers.
These recent trends highlight how external events directly influence not only how much activity occurs but also its economic viability for typical users.
Blockchain Size and Its Impact on Transactions
The size of the Bitcoin blockchain itself provides context about overall network activity; it stood at approximately 400 GB in early 2023—a significant increase from previous years due to continuous addition of new blocks containing transactional data.
A larger blockchain signifies more historical data stored across nodes worldwide but also raises concerns regarding scalability:
- Larger blockchains require more storage capacity.
- Synchronization times increase for new nodes joining the network.
- Higher data loads can contribute to slower confirmation times during peak periods unless scaling solutions are implemented effectively.
Efforts such as Lightning Network aim to address these scalability challenges by enabling faster off-chain transactions while maintaining security through underlying blockchain settlement layers.
The Role of Miners and Validation Processes
Miners play a crucial role in maintaining accurate records by validating transactions through complex computational puzzles—a process known as proof-of-work (PoW). They compete within seconds to add new blocks containing pending transactions onto the chain; successful miners receive rewards plus associated fees paid by transacting parties.
This validation process ensures integrity but is energy-intensive: estimates suggest that mining consumes substantial electricity globally. As demand increases with higher transaction volumes during active periods like April-May 2023’s surge,
the environmental footprint becomes more prominent concern among regulators and advocates alike.
Key Points About Mining:
- Miners validate hundreds of thousands of daily transactions
- Validation ensures decentralization & security
- Rising demand impacts energy consumption
Regulatory Environment's Effect on Transaction Volumes
Government policies significantly influence user participation levels on the Bitcoin network. In early 2023,
several countries introduced stricter regulations targeting crypto exchanges,which temporarily dampened trading activities reflected through decreased transaction counts initially observed after policy announcements.
However,
some jurisdictions adopted clearer frameworks encouraging institutional involvement,potentially stabilizing or increasing future transactional activity once compliance mechanisms were established.
Summary:
Regulatory uncertainty remains one of the most unpredictable factors affecting total bitcoin transactions; ongoing legislative developments will continue shaping usage patterns moving forward.
Future Outlook: Scalability Solutions & Adoption Trends
As interest grows among retail investors and institutions alike,
scalability solutions such as Taproot upgrades,Lightning Network implementations,and sidechains aim to facilitate faster processing at lower costs.
These technological advancements could help sustain higher throughput levels necessary for mainstream adoption while reducing congestion-related fee hikes seen earlier this year.
Moreover,
wider acceptance from merchants accepting bitcoin payments directly enhances real-world utility beyond speculative trading,
potentially leading toward sustained growth in total number of daily transactions over coming years.
By continuously monitoring metrics like total bitcoin transaction count alongside technological improvements and regulatory changes,
stakeholders—from individual users to large-scale investors—can better understand market dynamics
and make informed decisions aligned with evolving industry conditions.
References
- CoinDesk — General information on Bitcoin networks
- Blockchain.com Charts — Historical data analysis
- Blockchain Size Data — Blockchain growth insights
- Transaction Fees & Congestion — Impact analysis
- Bitcoin Mining Process — Technical validation overview
- Regulatory Impact Reports — Policy effects assessment
Understanding how many people transact using Bitcoin provides valuable insight into its current state—and future potential—as both an investment asset and a decentralized payment system amidst an ever-changing global landscape
What is Wallet Address Clustering?
Wallet address clustering is a crucial technique in the blockchain and cryptocurrency ecosystem that involves grouping multiple wallet addresses based on shared transaction behaviors or characteristics. This process helps analysts, security professionals, and regulators better understand how digital assets move across the network, identify potential illicit activities, and improve privacy measures for users.
Understanding Wallet Addresses in Cryptocurrency
In the world of cryptocurrencies like Bitcoin and Ethereum, each user interacts with the blockchain through wallet addresses—unique alphanumeric strings that serve as digital bank accounts. These addresses are generated cryptographically to ensure pseudonymity; they do not directly reveal personal identities. However, despite this pseudonymity, all transactions linked to these addresses are publicly recorded on the blockchain ledger.
As transaction volumes grow exponentially over time, it becomes increasingly difficult to maintain complete anonymity for individual users. Every transaction leaves a trail that can potentially be traced back to specific entities or behaviors if analyzed correctly. This is where wallet address clustering comes into play—it aims to analyze patterns across multiple addresses to infer relationships or groupings.
How Does Wallet Address Clustering Work?
Wallet address clustering employs various algorithms and analytical techniques designed to detect similarities among different addresses based on their activity patterns. These methods include:
- Transaction Pattern Analysis: Examining transfer amounts, timing between transactions, and frequency.
- Behavioral Signatures: Identifying common usage habits such as recurring transfers or specific asset types.
- Graph-Based Clustering: Creating visual maps of interconnected addresses based on shared inputs or outputs within transactions.
Popular algorithms used in this context include k-means clustering (which partitions data into predefined groups), hierarchical clustering (which builds nested clusters), and density-based methods like DBSCAN (which identifies clusters of varying shapes). Each has its strengths depending on dataset complexity and analysis goals.
Why Is Wallet Address Clustering Important?
The significance of wallet address clustering extends across several key areas:
Enhancing Privacy
While cryptocurrencies are often touted for their privacy features, true anonymity remains elusive due to transparent transaction records. By grouping related addresses together through clustering techniques, third parties find it more challenging to link individual transactions back to specific users—especially when combined with other privacy-preserving tools like mixers or privacy coins.
Security Monitoring
Clustering enables security teams and law enforcement agencies to detect suspicious activities such as money laundering schemes or fraud rings by spotting unusual patterns—like rapid transfers between clustered groups or large volume spikes—that deviate from typical user behavior.
Regulatory Compliance
Financial institutions operating within regulatory frameworks use wallet address analysis for anti-money laundering (AML) efforts and know-your-customer (KYC) procedures. While full anonymization isn't always possible with effective clustering tools, these techniques help create a more compliant environment by providing insights into transactional relationships without exposing sensitive details unnecessarily.
Recent Advances in Wallet Address Clustering
Over recent years, significant progress has been made in refining clustering methodologies:
- Improved Algorithms: Researchers have developed sophisticated models capable of handling vast datasets efficiently while uncovering complex behavioral patterns.
- Integration Into Blockchain Analytics Platforms: Major analytics providers now incorporate advanced clustering features into their tools—enabling users ranging from law enforcement agencies to financial firms—to gain deeper insights.
- Privacy-Centric Cryptocurrencies: Some projects have integrated cluster-aware features directly into their protocols—for example, enhancing user privacy while still allowing legitimate analysis under certain conditions—which reflects ongoing innovation balancing transparency with confidentiality.
Challenges & Ethical Considerations
Despite its benefits, wallet address clustering raises important concerns:
Regulatory Dilemmas: As authorities seek greater oversight over illicit activities like money laundering or terrorist financing via blockchain analysis tools—including those employing clustering—they face challenges balancing user privacy rights against compliance needs.
Potential for Misuse: If improperly implemented—or used without proper safeguards—clustering could inadvertently obscure legitimate transactions involving businesses or individuals who rely on enhanced privacy measures.
Ethical Debates: The debate continues around whether such analytical techniques should be solely used for security purposes—or if they risk infringing upon personal freedoms by enabling pervasive surveillance without adequate oversight.
Timeline of Key Developments
Understanding how wallet address clustering has evolved provides context about its current state:
- 2020: Academic research focused on evaluating different algorithms' effectiveness at preserving user privacy while enabling meaningful analysis.
- 2021: Major blockchain analytics platforms began integrating advanced cluster detection features amid rising demand from compliance-focused clients.
- 2022: The rise of privacy-centric cryptocurrencies prompted developers to embed cluster-aware mechanisms directly within protocols themselves.
- 2023: Regulatory discussions intensified regarding how best practices can balance effective AML/KYC processes with respecting individual rights—a debate ongoing today.
By grasping what wallet address clustering entails—and recognizing both its capabilities and limitations—you can better appreciate its role within broader efforts toward secure yet private cryptocurrency usage. Whether you're an investor seeking insight into transaction behaviors—or a regulator aiming at compliance—the evolving landscape underscores the importance of understanding this powerful analytical tool in today's digital economy.
Keywords: cryptocurrency wallets | blockchain analysis | transaction pattern recognition | crypto privacy | AML compliance | crypto security | decentralized finance