How Do Slippage and Commissions Impact Backtested Trading Results?
Backtesting is a vital process for traders and investors to evaluate the potential performance of trading strategies before deploying real capital. It allows for testing ideas against historical market data, helping traders refine their approaches. However, the accuracy of backtest results can be significantly affected by factors like slippage and commissions—two elements that often get overlooked but are crucial for realistic performance assessment.
Understanding Slippage in Trading
Slippage occurs when there is a difference between the expected price of a trade and the actual execution price. This phenomenon is common in fast-moving or illiquid markets, where prices can change rapidly between order placement and execution. For example, if you place a market order to buy Bitcoin at $30,000, but due to high volatility or low liquidity, your order executes at $30,050 instead—this additional cost is slippage.
In backtesting scenarios, failing to account for slippage can lead to overly optimistic results because it assumes trades are executed exactly at desired prices. In real-world trading environments—especially in cryptocurrency markets known for their volatility—slippage can erode profit margins or turn profitable strategies into losses.
There are two main types of slippage:
- Market Order Slippage: Happens when executing market orders; prices may differ from current quotes.
- Limit Order Slippage: Occurs when limit orders are filled at different prices than specified due to market conditions.
Understanding these distinctions helps traders better model realistic outcomes during backtests.
The Role of Commissions in Trading Performance
Commissions refer to fees charged by exchanges or brokers each time a trade is executed. These fees vary widely depending on the platform—for instance, some exchanges charge flat fees per trade while others use tiered structures based on volume or type (maker vs. taker).
In many backtests, commissions are either simplified or ignored altogether; however, this oversight can lead to inflated profitability estimates. When factoring in commissions:
- Maker Fees: Paid when providing liquidity by placing limit orders that add depth to the order book.
- Taker Fees: Paid when removing liquidity through immediate execution of market orders.
For active traders who execute numerous trades daily—or high-frequency trading algorithms—the cumulative impact of commissions becomes substantial enough to influence overall strategy viability significantly.
How Slippage and Commissions Affect Backtest Accuracy
Ignoring these costs during backtesting creates an overly optimistic picture that might not hold up under live conditions. Specifically:
Overestimating Profits: Without accounting for transaction costs and execution delays caused by slippage, strategies may appear more profitable than they truly are.
Underestimating Risks: Strategies optimized without considering these factors might perform poorly once deployed because actual trading costs eat into profits or exacerbate losses.
Misleading Optimization Results: Overfitting models based solely on idealized data leads traders toward strategies unlikely to succeed outside controlled simulations.
Research indicates that neglecting slippage and commissions can inflate perceived strategy performance by as much as 30%. This discrepancy underscores why incorporating realistic assumptions about transaction costs is essential for credible backtesting outcomes.
Recent Advances in Modeling Slippage & Commissions
The evolving landscape of cryptocurrency markets has prompted researchers and software developers alike to improve how they simulate real-world trading conditions during backtests:
Sophisticated Modeling Techniques: Modern models now incorporate variables such as bid-ask spreads, order book depth analysis, recent volatility measures—and even simulate different types of orders—to produce more accurate estimates.
Enhanced Data Transparency from Exchanges: Many platforms now provide detailed fee structures alongside historical data feeds which help traders estimate commission costs more precisely.
Liquidity Analysis Tools: New tools analyze market liquidity metrics over various timeframes so traders can better understand potential slippages under different conditions—a critical factor given crypto markets' notorious volatility spikes.
These developments enable more reliable simulation environments where risks associated with transaction costs mirror those encountered during live trading sessions closely.
Practical Tips for Incorporating Costs into Backtests
To ensure your backtest results reflect real-world scenarios accurately:
- Use historical bid-ask spreads along with volume data whenever possible.
- Model both maker and taker fee structures relevant to your chosen exchange(s).
- Simulate different levels of slippage based on recent volatility patterns rather than assuming zero-cost executions.
- Regularly update your models with new data reflecting changing market dynamics.
- Leverage advanced software tools like Backtrader or Zipline that support built-in features for modeling transaction costs effectively.
By following these best practices—and understanding how each factor influences outcomes—you'll develop more robust strategies less prone to failure once traded live.
Potential Risks When Ignoring These Factors
Failing to consider slippages and commissions carries notable risks:
Traders may develop overly aggressive expectations about profitability leading them astray once they face actual trading frictions.
Overfitted strategies optimized under idealized assumptions tend not only fail but could also incur significant financial losses if unaccounted-for costs eat away margins unexpectedly.
Misjudging risk-reward ratios due solely on pristine backtest results increases exposure—not just financially but also psychologically—as discrepancies between simulated success and real-world performance shake confidence in one's approach.
Improving Strategy Development Through Realistic Backtesting Conditions
Integrating accurate models of transaction costs enhances strategic robustness considerably—a necessity especially within volatile crypto markets where rapid price swings amplify both opportunities and risks alike.. By acknowledging how slippages occur across different order types (market vs limit) alongside precise commission calculations tailored per exchange’s fee structure enables better risk management decisions before risking actual capital.
Final Thoughts: Building Trustworthy Strategies
Incorporating considerations such as slippages and commissions isn't merely an academic exercise—it’s fundamental for developing trustworthy trading systems capable of performing consistently over time.. As technology advances—with improved modeling techniques—and transparency around exchange fees increases—traders have greater tools available today than ever before.. Embracing these developments ensures your strategy evaluations remain grounded in reality rather than idealized assumptions.
By doing so you reduce surprises during live deployment while increasing confidence that your approach will withstand unpredictable market movements.. Ultimately this leads toward smarter decision-making rooted firmly in comprehensive risk assessment principles essential across all levels—from beginner enthusiasts through seasoned professionals seeking sustainable growth paths within dynamic cryptocurrency landscapes


JCUSER-F1IIaxXA
2025-05-14 05:21
How do slippage and commissions impact backtested results?
How Do Slippage and Commissions Impact Backtested Trading Results?
Backtesting is a vital process for traders and investors to evaluate the potential performance of trading strategies before deploying real capital. It allows for testing ideas against historical market data, helping traders refine their approaches. However, the accuracy of backtest results can be significantly affected by factors like slippage and commissions—two elements that often get overlooked but are crucial for realistic performance assessment.
Understanding Slippage in Trading
Slippage occurs when there is a difference between the expected price of a trade and the actual execution price. This phenomenon is common in fast-moving or illiquid markets, where prices can change rapidly between order placement and execution. For example, if you place a market order to buy Bitcoin at $30,000, but due to high volatility or low liquidity, your order executes at $30,050 instead—this additional cost is slippage.
In backtesting scenarios, failing to account for slippage can lead to overly optimistic results because it assumes trades are executed exactly at desired prices. In real-world trading environments—especially in cryptocurrency markets known for their volatility—slippage can erode profit margins or turn profitable strategies into losses.
There are two main types of slippage:
- Market Order Slippage: Happens when executing market orders; prices may differ from current quotes.
- Limit Order Slippage: Occurs when limit orders are filled at different prices than specified due to market conditions.
Understanding these distinctions helps traders better model realistic outcomes during backtests.
The Role of Commissions in Trading Performance
Commissions refer to fees charged by exchanges or brokers each time a trade is executed. These fees vary widely depending on the platform—for instance, some exchanges charge flat fees per trade while others use tiered structures based on volume or type (maker vs. taker).
In many backtests, commissions are either simplified or ignored altogether; however, this oversight can lead to inflated profitability estimates. When factoring in commissions:
- Maker Fees: Paid when providing liquidity by placing limit orders that add depth to the order book.
- Taker Fees: Paid when removing liquidity through immediate execution of market orders.
For active traders who execute numerous trades daily—or high-frequency trading algorithms—the cumulative impact of commissions becomes substantial enough to influence overall strategy viability significantly.
How Slippage and Commissions Affect Backtest Accuracy
Ignoring these costs during backtesting creates an overly optimistic picture that might not hold up under live conditions. Specifically:
Overestimating Profits: Without accounting for transaction costs and execution delays caused by slippage, strategies may appear more profitable than they truly are.
Underestimating Risks: Strategies optimized without considering these factors might perform poorly once deployed because actual trading costs eat into profits or exacerbate losses.
Misleading Optimization Results: Overfitting models based solely on idealized data leads traders toward strategies unlikely to succeed outside controlled simulations.
Research indicates that neglecting slippage and commissions can inflate perceived strategy performance by as much as 30%. This discrepancy underscores why incorporating realistic assumptions about transaction costs is essential for credible backtesting outcomes.
Recent Advances in Modeling Slippage & Commissions
The evolving landscape of cryptocurrency markets has prompted researchers and software developers alike to improve how they simulate real-world trading conditions during backtests:
Sophisticated Modeling Techniques: Modern models now incorporate variables such as bid-ask spreads, order book depth analysis, recent volatility measures—and even simulate different types of orders—to produce more accurate estimates.
Enhanced Data Transparency from Exchanges: Many platforms now provide detailed fee structures alongside historical data feeds which help traders estimate commission costs more precisely.
Liquidity Analysis Tools: New tools analyze market liquidity metrics over various timeframes so traders can better understand potential slippages under different conditions—a critical factor given crypto markets' notorious volatility spikes.
These developments enable more reliable simulation environments where risks associated with transaction costs mirror those encountered during live trading sessions closely.
Practical Tips for Incorporating Costs into Backtests
To ensure your backtest results reflect real-world scenarios accurately:
- Use historical bid-ask spreads along with volume data whenever possible.
- Model both maker and taker fee structures relevant to your chosen exchange(s).
- Simulate different levels of slippage based on recent volatility patterns rather than assuming zero-cost executions.
- Regularly update your models with new data reflecting changing market dynamics.
- Leverage advanced software tools like Backtrader or Zipline that support built-in features for modeling transaction costs effectively.
By following these best practices—and understanding how each factor influences outcomes—you'll develop more robust strategies less prone to failure once traded live.
Potential Risks When Ignoring These Factors
Failing to consider slippages and commissions carries notable risks:
Traders may develop overly aggressive expectations about profitability leading them astray once they face actual trading frictions.
Overfitted strategies optimized under idealized assumptions tend not only fail but could also incur significant financial losses if unaccounted-for costs eat away margins unexpectedly.
Misjudging risk-reward ratios due solely on pristine backtest results increases exposure—not just financially but also psychologically—as discrepancies between simulated success and real-world performance shake confidence in one's approach.
Improving Strategy Development Through Realistic Backtesting Conditions
Integrating accurate models of transaction costs enhances strategic robustness considerably—a necessity especially within volatile crypto markets where rapid price swings amplify both opportunities and risks alike.. By acknowledging how slippages occur across different order types (market vs limit) alongside precise commission calculations tailored per exchange’s fee structure enables better risk management decisions before risking actual capital.
Final Thoughts: Building Trustworthy Strategies
Incorporating considerations such as slippages and commissions isn't merely an academic exercise—it’s fundamental for developing trustworthy trading systems capable of performing consistently over time.. As technology advances—with improved modeling techniques—and transparency around exchange fees increases—traders have greater tools available today than ever before.. Embracing these developments ensures your strategy evaluations remain grounded in reality rather than idealized assumptions.
By doing so you reduce surprises during live deployment while increasing confidence that your approach will withstand unpredictable market movements.. Ultimately this leads toward smarter decision-making rooted firmly in comprehensive risk assessment principles essential across all levels—from beginner enthusiasts through seasoned professionals seeking sustainable growth paths within dynamic cryptocurrency landscapes
免责声明:含第三方内容,非财务建议。
详见《条款和条件》
What is ADX? A Complete Guide to the Average Directional Index
Understanding the Average Directional Index (ADX) is essential for traders and investors aiming to gauge market strength and identify potential trend opportunities. Developed by J. Wells Wilder in the 1970s, ADX has stood the test of time as a reliable technical analysis tool used across various financial markets, including stocks, forex, commodities, and increasingly in cryptocurrencies.
What Does ADX Measure?
The primary purpose of the ADX is to quantify the strength of a prevailing trend—whether upward or downward—regardless of its direction. Unlike other indicators that focus on predicting price movement or identifying overbought/oversold conditions, ADX specifically assesses how strong or weak a trend is at any given moment. This makes it particularly valuable for traders who want confirmation before entering or exiting positions.
The indicator operates on a scale from 0 to 100: values closer to 0 suggest minimal trend activity or sideways movement (ranging market), while higher values indicate robust trending behavior. Typically, an ADX above 25 signals a strong trend worth trading in; below 20 suggests a weak or consolidating market.
How Is ADX Calculated?
Calculating the ADX involves several steps that incorporate high, low, and closing prices over a specified period—commonly 14 days but adjustable based on trading style:
- Determine True Range (TR): Measures volatility by considering current high-low range along with gaps from previous close.
- Calculate Positive & Negative Directional Movement (+DM and -DM): Identifies upward and downward price movements.
- Smooth these values: Using Wilder’s smoothing method similar to exponential moving averages.
- Compute DI+ and DI-: These are directional indicators representing buying (+DI) versus selling (-DI) pressure.
- Derive DX: The difference between +DI and -DI divided by their sum; this measures directional movement magnitude.
- Calculate ADX: Smooths DX over time to produce an overall measure of trend strength.
This process results in an indicator that fluctuates based on recent price action but provides clarity about whether trends are gaining or losing momentum.
Using ADX in Trading Strategies
Traders leverage the ADX primarily for its ability to confirm trends rather than predict them outright:
- When ADX rises above 25–30 — it indicates increasing trend strength; traders often look for entry points aligned with this momentum.
- When ADX falls below 20 — it suggests weakening trends; many traders avoid initiating new trades during such periods unless other signals confirm potential reversals.
- Combining ADX with DI+/-: Crossovers between positive and negative directional indicators can signal potential entries when confirmed by rising/trending markets indicated by high ADX levels.
For example:
- A rising +DI crossing above -DI alongside an increasing ADX might signal an emerging bullish trend suitable for long positions.
- Conversely, if -DI crosses above +DI while the ADX remains high — it could indicate strengthening bearish momentum.
In practice, many traders use multiple technical tools alongside the ADX—such as moving averages, RSI (Relative Strength Index), MACD—to develop comprehensive strategies like trending followingsystems or mean reversion approaches.
Advantages of Using The Average Directional Index
One key benefit of incorporating ADC into your toolkit is its ability to filter out false signals common in volatile markets like cryptocurrencies where rapid price swings can mislead less sophisticated indicators. Because it measures trend strength, not direction alone—it helps traders avoid entering trades during choppy sideways phases where profits are harder to realize.
Additionally:
- It adapts well across different asset classes
- It provides clear thresholds (e.g., >25 indicating strong trends)
- It complements other technical tools effectively
Limitations And Risks Of Relying On ADC
Despite its strengths, relying solely on ADC can lead to pitfalls:
- Overreliance may cause overtrading: Traders might enter too many trades based solely on rising ADC without considering fundamental factors influencing asset prices.
- False signals during volatile periods: Cryptocurrency markets’ inherent volatility can generate misleading readings where high ADC does not necessarily translate into sustainable trends.
- Lagging nature: As with most lagging indicators derived from past prices—ADx may delay recognizing sudden reversals or breakouts requiring additional confirmation tools like volume analysis or candlestick patterns.
Market Volatility And Its Impact On The Indicator
Cryptocurrency markets exemplify environments where volatility significantly impacts technical analysis accuracy—including that of ADAx readings:
- Rapid swings can produce abrupt changes in indicator levels
- False positives become more frequent during turbulent phases
Therefore, integrating broader context—including news events and macroeconomic factors—is crucial when interpreting ADC signals within highly volatile assets such as Bitcoin or altcoins involved in DeFi projects today.
Historical Development And Adoption Trends
Since its inception in the early '70s by J.Wilder—a pioneer who also introduced RSI—the use of average directional indices expanded beyond traditional equities into forex trading through increased accessibility via modern charting platforms around the early 2000s.
In recent years:
• Cryptocurrencies have embraced advanced technical analysis tools due partly due to their effectiveness amid unpredictable price movements
• Trading platforms now commonly include built-in support for calculating & visualizing ADAx
• Traders combine ADAx with machine learning algorithms for automated decision-making processes
This evolution underscores how vital understanding market dynamics has become across diverse financial sectors—from stocks & commodities all through digital assets like NFTs & DeFi tokens—informed decision-making driven by reliable metrics such as ADAx enhances profitability prospects while managing risk effectively.
Applying E-A-T Principles To Your Trading Approach
Expertise: Developing proficiency with ADAx requires understanding both its mathematical foundation and practical application within broader strategies tailored specifically for your chosen asset class—be it crypto coins or traditional securities—and aligning this knowledge with ongoing education about market behaviors ensures informed decisions backed by data-driven insights.
Authoritativeness: Relying on reputable sources—including academic research papers authored by Wilder himself—and integrating insights from seasoned analysts enhances credibility when deploying this indicator within your trading plan.
Trustworthiness: Consistently backtest strategies involving ADAx against historical data relevant to your assets ensures reliability before risking real capital; combining quantitative metrics with fundamental analysis fosters responsible trading practices.
Final Thoughts
The Average Directional Index remains one of the most effective tools available today for assessing whether markets are trending strongly enough for profitable trade execution—or whether they’re better suited for cautious observation during consolidation phases . Its adaptability across different asset classes makes it invaluable—from traditional stocks through forex—and especially within cryptocurrency landscapes characterized by rapid shifts yet persistent opportunities when correctly interpreted.
By understanding how ADR works alongside other technical indicators—and recognizing both its strengths and limitations—you position yourself better equippedto navigate complex financial environments confidently while managing risk intelligently.

Lo
2025-05-20 03:14
What’s ADX?
What is ADX? A Complete Guide to the Average Directional Index
Understanding the Average Directional Index (ADX) is essential for traders and investors aiming to gauge market strength and identify potential trend opportunities. Developed by J. Wells Wilder in the 1970s, ADX has stood the test of time as a reliable technical analysis tool used across various financial markets, including stocks, forex, commodities, and increasingly in cryptocurrencies.
What Does ADX Measure?
The primary purpose of the ADX is to quantify the strength of a prevailing trend—whether upward or downward—regardless of its direction. Unlike other indicators that focus on predicting price movement or identifying overbought/oversold conditions, ADX specifically assesses how strong or weak a trend is at any given moment. This makes it particularly valuable for traders who want confirmation before entering or exiting positions.
The indicator operates on a scale from 0 to 100: values closer to 0 suggest minimal trend activity or sideways movement (ranging market), while higher values indicate robust trending behavior. Typically, an ADX above 25 signals a strong trend worth trading in; below 20 suggests a weak or consolidating market.
How Is ADX Calculated?
Calculating the ADX involves several steps that incorporate high, low, and closing prices over a specified period—commonly 14 days but adjustable based on trading style:
- Determine True Range (TR): Measures volatility by considering current high-low range along with gaps from previous close.
- Calculate Positive & Negative Directional Movement (+DM and -DM): Identifies upward and downward price movements.
- Smooth these values: Using Wilder’s smoothing method similar to exponential moving averages.
- Compute DI+ and DI-: These are directional indicators representing buying (+DI) versus selling (-DI) pressure.
- Derive DX: The difference between +DI and -DI divided by their sum; this measures directional movement magnitude.
- Calculate ADX: Smooths DX over time to produce an overall measure of trend strength.
This process results in an indicator that fluctuates based on recent price action but provides clarity about whether trends are gaining or losing momentum.
Using ADX in Trading Strategies
Traders leverage the ADX primarily for its ability to confirm trends rather than predict them outright:
- When ADX rises above 25–30 — it indicates increasing trend strength; traders often look for entry points aligned with this momentum.
- When ADX falls below 20 — it suggests weakening trends; many traders avoid initiating new trades during such periods unless other signals confirm potential reversals.
- Combining ADX with DI+/-: Crossovers between positive and negative directional indicators can signal potential entries when confirmed by rising/trending markets indicated by high ADX levels.
For example:
- A rising +DI crossing above -DI alongside an increasing ADX might signal an emerging bullish trend suitable for long positions.
- Conversely, if -DI crosses above +DI while the ADX remains high — it could indicate strengthening bearish momentum.
In practice, many traders use multiple technical tools alongside the ADX—such as moving averages, RSI (Relative Strength Index), MACD—to develop comprehensive strategies like trending followingsystems or mean reversion approaches.
Advantages of Using The Average Directional Index
One key benefit of incorporating ADC into your toolkit is its ability to filter out false signals common in volatile markets like cryptocurrencies where rapid price swings can mislead less sophisticated indicators. Because it measures trend strength, not direction alone—it helps traders avoid entering trades during choppy sideways phases where profits are harder to realize.
Additionally:
- It adapts well across different asset classes
- It provides clear thresholds (e.g., >25 indicating strong trends)
- It complements other technical tools effectively
Limitations And Risks Of Relying On ADC
Despite its strengths, relying solely on ADC can lead to pitfalls:
- Overreliance may cause overtrading: Traders might enter too many trades based solely on rising ADC without considering fundamental factors influencing asset prices.
- False signals during volatile periods: Cryptocurrency markets’ inherent volatility can generate misleading readings where high ADC does not necessarily translate into sustainable trends.
- Lagging nature: As with most lagging indicators derived from past prices—ADx may delay recognizing sudden reversals or breakouts requiring additional confirmation tools like volume analysis or candlestick patterns.
Market Volatility And Its Impact On The Indicator
Cryptocurrency markets exemplify environments where volatility significantly impacts technical analysis accuracy—including that of ADAx readings:
- Rapid swings can produce abrupt changes in indicator levels
- False positives become more frequent during turbulent phases
Therefore, integrating broader context—including news events and macroeconomic factors—is crucial when interpreting ADC signals within highly volatile assets such as Bitcoin or altcoins involved in DeFi projects today.
Historical Development And Adoption Trends
Since its inception in the early '70s by J.Wilder—a pioneer who also introduced RSI—the use of average directional indices expanded beyond traditional equities into forex trading through increased accessibility via modern charting platforms around the early 2000s.
In recent years:
• Cryptocurrencies have embraced advanced technical analysis tools due partly due to their effectiveness amid unpredictable price movements
• Trading platforms now commonly include built-in support for calculating & visualizing ADAx
• Traders combine ADAx with machine learning algorithms for automated decision-making processes
This evolution underscores how vital understanding market dynamics has become across diverse financial sectors—from stocks & commodities all through digital assets like NFTs & DeFi tokens—informed decision-making driven by reliable metrics such as ADAx enhances profitability prospects while managing risk effectively.
Applying E-A-T Principles To Your Trading Approach
Expertise: Developing proficiency with ADAx requires understanding both its mathematical foundation and practical application within broader strategies tailored specifically for your chosen asset class—be it crypto coins or traditional securities—and aligning this knowledge with ongoing education about market behaviors ensures informed decisions backed by data-driven insights.
Authoritativeness: Relying on reputable sources—including academic research papers authored by Wilder himself—and integrating insights from seasoned analysts enhances credibility when deploying this indicator within your trading plan.
Trustworthiness: Consistently backtest strategies involving ADAx against historical data relevant to your assets ensures reliability before risking real capital; combining quantitative metrics with fundamental analysis fosters responsible trading practices.
Final Thoughts
The Average Directional Index remains one of the most effective tools available today for assessing whether markets are trending strongly enough for profitable trade execution—or whether they’re better suited for cautious observation during consolidation phases . Its adaptability across different asset classes makes it invaluable—from traditional stocks through forex—and especially within cryptocurrency landscapes characterized by rapid shifts yet persistent opportunities when correctly interpreted.
By understanding how ADR works alongside other technical indicators—and recognizing both its strengths and limitations—you position yourself better equippedto navigate complex financial environments confidently while managing risk intelligently.
免责声明:含第三方内容,非财务建议。
详见《条款和条件》
How Many Indicators Can MT4 Display Simultaneously?
MetaTrader 4 (MT4) remains one of the most popular trading platforms among forex traders and financial analysts worldwide. Its user-friendly interface, extensive charting tools, and customizable features have made it a preferred choice for both beginners and experienced traders. However, despite its versatility, MT4 has a notable limitation that can impact comprehensive technical analysis: the maximum number of indicators that can be displayed on a single chart.
Understanding MT4’s Indicator Limit
One of the key constraints in MT4 is its built-in cap on simultaneous indicator display. The platform allows up to 28 indicators per chart, which might seem sufficient at first glance but can become restrictive when traders rely on multiple complex or layered indicators for detailed analysis.
This limit has been consistent since the early versions of MT4, with no significant updates from MetaQuotes—the developer behind MT4—over the years to increase this capacity. As such, traders often find themselves needing to prioritize which indicators are most critical or seek alternative solutions.
Why Is There a Limit on Indicators?
The restriction primarily stems from technical considerations related to system performance and stability. Rendering numerous indicators simultaneously requires significant processing power and memory resources. By capping this number at 28, MetaQuotes aims to balance functionality with platform stability across various hardware configurations.
Furthermore, some complex indicators or custom scripts may also consume considerable resources; thus, limiting their number helps prevent potential crashes or lag during trading sessions.
Impact on Traders’ Technical Analysis
For many traders who prefer using multiple overlapping tools—such as moving averages combined with oscillators like RSI or Bollinger Bands—the indicator limit can be frustrating. It forces them into making strategic choices about which tools are essential for their trading style.
In practice:
- Traders might need to combine certain signals into composite indicators.
- They may use different charts for different sets of analyses.
- Some opt for third-party software integrations that bypass these restrictions altogether.
This limitation emphasizes the importance of efficient indicator management and strategic planning in technical analysis workflows within MT4's environment.
Workarounds and Alternatives
Given this constraint, many users turn to workarounds:
- Multiple Charts: Spreading different sets of indicators across several charts within the same workspace allows broader coverage without exceeding individual chart limits.
- Custom Scripts & Expert Advisors: Advanced users develop custom scripts that combine multiple signals into fewer overlays.
- Third-party Tools: Several third-party platforms or add-ons claim to extend indicator capacity beyond what native MT4 offers—though these often come at additional costs or require more technical expertise.
However, it's important to note that relying heavily on workarounds may introduce new challenges such as increased complexity in managing multiple charts or compatibility issues with updates.
Recent Developments & Future Outlook
As of May 2025, there have been no official announcements from MetaQuotes regarding an increase in this indicator limit. The platform remains largely unchanged since its initial release in 2005 concerning this aspect—a testament perhaps to prioritizing stability over feature expansion in this area.
The absence of updates suggests that traders seeking higher flexibility might consider transitioning toward other platforms like MetaTrader 5 (MT5), which supports more advanced features including an increased number of simultaneous indicators (up to 100). Nonetheless, many still prefer sticking with MT4 due to familiarity and widespread adoption among brokers worldwide.
How This Limitation Affects Trading Strategies
The inability to display unlimited indicators directly influences how traders develop their strategies:
- It encourages more streamlined setups focusing only on essential signals.
- Traders must optimize their use by selecting multi-purpose tools rather than numerous individual ones.
- For those requiring extensive analytical layers—such as institutional investors—it may necessitate integrating external software solutions outside native MT4 capabilities.
This constraint underscores a broader theme within trading technology: balancing feature richness against system performance and user experience is crucial but sometimes results in trade-offs like these limitations.
Final Thoughts
While MetaTrader 4 remains highly regarded for its reliability and ease-of-use within retail forex trading circles, its maximum indicator display limit continues to be a point worth considering when planning your analytical approach. For casual traders conducting straightforward analyses, 28 indicators often suffice; however, professional analysts demanding deeper insights might need supplementary tools or consider upgrading platforms altogether.
Key Takeaways
- Maximum Indicators per Chart: Typically capped at 28 in standard MT4 installations.
- Historical Consistency: No significant changes since initial release (2005).
- Workarounds: Use multiple charts; employ custom scripts; explore third-party software solutions.
- Future Prospects: No official plans from MetaQuotes yet; alternatives like MT5 offer higher capacities.
Understanding these limitations helps set realistic expectations while encouraging efficient strategy development tailored within existing platform constraints—and highlights areas where technological advancements could improve trader experience moving forward.
JCUSER-WVMdslBw
2025-05-26 12:50
How many indicators can MT4 display simultaneously?
How Many Indicators Can MT4 Display Simultaneously?
MetaTrader 4 (MT4) remains one of the most popular trading platforms among forex traders and financial analysts worldwide. Its user-friendly interface, extensive charting tools, and customizable features have made it a preferred choice for both beginners and experienced traders. However, despite its versatility, MT4 has a notable limitation that can impact comprehensive technical analysis: the maximum number of indicators that can be displayed on a single chart.
Understanding MT4’s Indicator Limit
One of the key constraints in MT4 is its built-in cap on simultaneous indicator display. The platform allows up to 28 indicators per chart, which might seem sufficient at first glance but can become restrictive when traders rely on multiple complex or layered indicators for detailed analysis.
This limit has been consistent since the early versions of MT4, with no significant updates from MetaQuotes—the developer behind MT4—over the years to increase this capacity. As such, traders often find themselves needing to prioritize which indicators are most critical or seek alternative solutions.
Why Is There a Limit on Indicators?
The restriction primarily stems from technical considerations related to system performance and stability. Rendering numerous indicators simultaneously requires significant processing power and memory resources. By capping this number at 28, MetaQuotes aims to balance functionality with platform stability across various hardware configurations.
Furthermore, some complex indicators or custom scripts may also consume considerable resources; thus, limiting their number helps prevent potential crashes or lag during trading sessions.
Impact on Traders’ Technical Analysis
For many traders who prefer using multiple overlapping tools—such as moving averages combined with oscillators like RSI or Bollinger Bands—the indicator limit can be frustrating. It forces them into making strategic choices about which tools are essential for their trading style.
In practice:
- Traders might need to combine certain signals into composite indicators.
- They may use different charts for different sets of analyses.
- Some opt for third-party software integrations that bypass these restrictions altogether.
This limitation emphasizes the importance of efficient indicator management and strategic planning in technical analysis workflows within MT4's environment.
Workarounds and Alternatives
Given this constraint, many users turn to workarounds:
- Multiple Charts: Spreading different sets of indicators across several charts within the same workspace allows broader coverage without exceeding individual chart limits.
- Custom Scripts & Expert Advisors: Advanced users develop custom scripts that combine multiple signals into fewer overlays.
- Third-party Tools: Several third-party platforms or add-ons claim to extend indicator capacity beyond what native MT4 offers—though these often come at additional costs or require more technical expertise.
However, it's important to note that relying heavily on workarounds may introduce new challenges such as increased complexity in managing multiple charts or compatibility issues with updates.
Recent Developments & Future Outlook
As of May 2025, there have been no official announcements from MetaQuotes regarding an increase in this indicator limit. The platform remains largely unchanged since its initial release in 2005 concerning this aspect—a testament perhaps to prioritizing stability over feature expansion in this area.
The absence of updates suggests that traders seeking higher flexibility might consider transitioning toward other platforms like MetaTrader 5 (MT5), which supports more advanced features including an increased number of simultaneous indicators (up to 100). Nonetheless, many still prefer sticking with MT4 due to familiarity and widespread adoption among brokers worldwide.
How This Limitation Affects Trading Strategies
The inability to display unlimited indicators directly influences how traders develop their strategies:
- It encourages more streamlined setups focusing only on essential signals.
- Traders must optimize their use by selecting multi-purpose tools rather than numerous individual ones.
- For those requiring extensive analytical layers—such as institutional investors—it may necessitate integrating external software solutions outside native MT4 capabilities.
This constraint underscores a broader theme within trading technology: balancing feature richness against system performance and user experience is crucial but sometimes results in trade-offs like these limitations.
Final Thoughts
While MetaTrader 4 remains highly regarded for its reliability and ease-of-use within retail forex trading circles, its maximum indicator display limit continues to be a point worth considering when planning your analytical approach. For casual traders conducting straightforward analyses, 28 indicators often suffice; however, professional analysts demanding deeper insights might need supplementary tools or consider upgrading platforms altogether.
Key Takeaways
- Maximum Indicators per Chart: Typically capped at 28 in standard MT4 installations.
- Historical Consistency: No significant changes since initial release (2005).
- Workarounds: Use multiple charts; employ custom scripts; explore third-party software solutions.
- Future Prospects: No official plans from MetaQuotes yet; alternatives like MT5 offer higher capacities.
Understanding these limitations helps set realistic expectations while encouraging efficient strategy development tailored within existing platform constraints—and highlights areas where technological advancements could improve trader experience moving forward.
免责声明:含第三方内容,非财务建议。
详见《条款和条件》
Limit Order vs. Market Order: A Complete Guide for Investors and Traders
Understanding how to effectively execute trades is fundamental for anyone involved in investing or trading. Two primary types of orders—limit orders and market orders—serve different purposes and come with distinct advantages and risks. Knowing when and how to use each can significantly impact your investment outcomes, especially in volatile markets like stocks or cryptocurrencies.
What Is a Limit Order?
A limit order is an instruction to buy or sell a security at a specific price or better. When placing a limit buy order, you set the maximum price you're willing to pay; for a limit sell, you specify the minimum price you're willing to accept. This type of order remains open until it is either executed at your specified price or canceled by you.
Limit orders are particularly useful when investors want control over their entry or exit points, especially during periods of high volatility where prices can fluctuate rapidly. For example, if Bitcoin is trading at $40,000 but you believe it will drop further before rising again, placing a limit buy order at $38,000 allows you to potentially purchase the asset at that lower price without constantly monitoring the market.
How Does a Market Order Work?
In contrast, a market order instructs your broker to execute the trade immediately at the best available current market price. This type of order prioritizes speed over price precision; as soon as your broker receives it, they will fill it based on current liquidity and prevailing prices.
Market orders are favored by traders who need quick execution—such as day traders—or investors who want certainty that their trade will be completed promptly regardless of minor fluctuations in price. For instance, if an investor wants to quickly capitalize on news-driven momentum in stock prices during high-volume trading hours, executing with a market order ensures immediate action but may result in paying slightly more than expected due to rapid changes.
Key Differences Between Limit Orders and Market Orders
While both serve essential roles within trading strategies, understanding their core differences helps investors choose appropriately:
Execution Speed:
- Limit Orders: May take time or may not execute if conditions aren’t met.
- Market Orders: Executed instantly once received.
Price Control:
- Limit Orders: Allow precise control over buying/selling prices.
- Market Orders: No control; executed at current market prices which can vary rapidly.
Risk Exposure:
- Limit Orders: Reduce risk of unfavorable trades but might not get filled.
- Market Orders: Ensure quick execution but risk paying more (or receiving less) than anticipated due to slippage.
Ideal Use Cases:
- Limit Orders: Suitable for long-term investors aiming for specific entry/exit points without reacting immediately.
- Market Orders: Better suited for short-term traders seeking swift execution amid fast-moving markets.
Recent Trends Impacting Order Types
The evolution of financial markets has seen increased reliance on these order types across various asset classes:
- In cryptocurrency markets—which are known for extreme volatility—limit orders help traders avoid sudden swings by setting predefined purchase or sale levels during surges like Bitcoin’s rapid rise in late 2021.
- During periods such as the COVID-19 pandemic’s stock market turbulence in 2020–2021, many investors turned toward limit orders as protective measures against unpredictable swings while maintaining strategic pricing targets.
- Regulatory bodies like the U.S. Securities and Exchange Commission (SEC) have been examining rules around transparency related to how these orders are executed — aiming both to protect retail investors from potential manipulation and ensure fairer access across platforms.
Risks Associated With Each Type
Despite their benefits, both types carry inherent risks that users should understand:
Risks with Limit Orders:
- If the target price isn’t reached within your specified timeframe—or ever—the trade remains unexecuted
- Large accumulation of unfilled limit orders can create artificial demand signals that influence other traders’ perceptions
Risks with Market Orders:
- Slippage occurs when rapid movements cause executions above (or below) expected prices
- During low liquidity periods (e.g., after-hours trading), executing large market orders might significantly impact asset prices adversely
Furthermore, improper use can lead traders into pitfalls such as "order imbalances," where too many pending limit bids distort normal supply-demand dynamics — potentially leading to delayed executions or unexpected costs.
Practical Tips for Choosing Between Limit and Market Orders
To optimize your trading strategy:
Use limit orders when:
- You’re targeting specific entry/exit points
- You wish to avoid paying above certain thresholds
- Trading assets with lower liquidity where immediate execution isn’t critical
Opt for market orders when:
- Speed matters more than exact pricing
- You need quick liquidation during volatile events
- The asset has high liquidity ensuring minimal slippage
Consider combining strategies—for example:
Place limit buy/sell limits near key support/resistance levels while using market stops around critical thresholds—to balance control with responsiveness.Always monitor open positions regularly because conditions change rapidly; what was advantageous yesterday might not hold today amid shifting markets.
By grasping these distinctions—and staying informed about recent developments—you empower yourself with better tools for navigating complex financial landscapes safely and efficiently.
References
- Applied Materials shares drop after weak China sales report (2025)
- Cryptocurrency Trading Strategies (2021)
- Stock Market Volatility & Trading Tactics (2020)
- SEC Regulatory Updates on Trading Practices (2023)
- Techniques Used in Market Manipulation & Their Impact (2022)
- Understanding Order Imbalance Effects on Markets (2022)
This comprehensive overview aims not only at clarifying technical differences but also providing practical insights aligned with user intent—helping both novice investors learn foundational concepts while offering seasoned traders nuanced considerations based on recent trends.*
JCUSER-WVMdslBw
2025-05-22 05:20
What is the difference between placing a "limit order" and a "market order"?
Limit Order vs. Market Order: A Complete Guide for Investors and Traders
Understanding how to effectively execute trades is fundamental for anyone involved in investing or trading. Two primary types of orders—limit orders and market orders—serve different purposes and come with distinct advantages and risks. Knowing when and how to use each can significantly impact your investment outcomes, especially in volatile markets like stocks or cryptocurrencies.
What Is a Limit Order?
A limit order is an instruction to buy or sell a security at a specific price or better. When placing a limit buy order, you set the maximum price you're willing to pay; for a limit sell, you specify the minimum price you're willing to accept. This type of order remains open until it is either executed at your specified price or canceled by you.
Limit orders are particularly useful when investors want control over their entry or exit points, especially during periods of high volatility where prices can fluctuate rapidly. For example, if Bitcoin is trading at $40,000 but you believe it will drop further before rising again, placing a limit buy order at $38,000 allows you to potentially purchase the asset at that lower price without constantly monitoring the market.
How Does a Market Order Work?
In contrast, a market order instructs your broker to execute the trade immediately at the best available current market price. This type of order prioritizes speed over price precision; as soon as your broker receives it, they will fill it based on current liquidity and prevailing prices.
Market orders are favored by traders who need quick execution—such as day traders—or investors who want certainty that their trade will be completed promptly regardless of minor fluctuations in price. For instance, if an investor wants to quickly capitalize on news-driven momentum in stock prices during high-volume trading hours, executing with a market order ensures immediate action but may result in paying slightly more than expected due to rapid changes.
Key Differences Between Limit Orders and Market Orders
While both serve essential roles within trading strategies, understanding their core differences helps investors choose appropriately:
Execution Speed:
- Limit Orders: May take time or may not execute if conditions aren’t met.
- Market Orders: Executed instantly once received.
Price Control:
- Limit Orders: Allow precise control over buying/selling prices.
- Market Orders: No control; executed at current market prices which can vary rapidly.
Risk Exposure:
- Limit Orders: Reduce risk of unfavorable trades but might not get filled.
- Market Orders: Ensure quick execution but risk paying more (or receiving less) than anticipated due to slippage.
Ideal Use Cases:
- Limit Orders: Suitable for long-term investors aiming for specific entry/exit points without reacting immediately.
- Market Orders: Better suited for short-term traders seeking swift execution amid fast-moving markets.
Recent Trends Impacting Order Types
The evolution of financial markets has seen increased reliance on these order types across various asset classes:
- In cryptocurrency markets—which are known for extreme volatility—limit orders help traders avoid sudden swings by setting predefined purchase or sale levels during surges like Bitcoin’s rapid rise in late 2021.
- During periods such as the COVID-19 pandemic’s stock market turbulence in 2020–2021, many investors turned toward limit orders as protective measures against unpredictable swings while maintaining strategic pricing targets.
- Regulatory bodies like the U.S. Securities and Exchange Commission (SEC) have been examining rules around transparency related to how these orders are executed — aiming both to protect retail investors from potential manipulation and ensure fairer access across platforms.
Risks Associated With Each Type
Despite their benefits, both types carry inherent risks that users should understand:
Risks with Limit Orders:
- If the target price isn’t reached within your specified timeframe—or ever—the trade remains unexecuted
- Large accumulation of unfilled limit orders can create artificial demand signals that influence other traders’ perceptions
Risks with Market Orders:
- Slippage occurs when rapid movements cause executions above (or below) expected prices
- During low liquidity periods (e.g., after-hours trading), executing large market orders might significantly impact asset prices adversely
Furthermore, improper use can lead traders into pitfalls such as "order imbalances," where too many pending limit bids distort normal supply-demand dynamics — potentially leading to delayed executions or unexpected costs.
Practical Tips for Choosing Between Limit and Market Orders
To optimize your trading strategy:
Use limit orders when:
- You’re targeting specific entry/exit points
- You wish to avoid paying above certain thresholds
- Trading assets with lower liquidity where immediate execution isn’t critical
Opt for market orders when:
- Speed matters more than exact pricing
- You need quick liquidation during volatile events
- The asset has high liquidity ensuring minimal slippage
Consider combining strategies—for example:
Place limit buy/sell limits near key support/resistance levels while using market stops around critical thresholds—to balance control with responsiveness.Always monitor open positions regularly because conditions change rapidly; what was advantageous yesterday might not hold today amid shifting markets.
By grasping these distinctions—and staying informed about recent developments—you empower yourself with better tools for navigating complex financial landscapes safely and efficiently.
References
- Applied Materials shares drop after weak China sales report (2025)
- Cryptocurrency Trading Strategies (2021)
- Stock Market Volatility & Trading Tactics (2020)
- SEC Regulatory Updates on Trading Practices (2023)
- Techniques Used in Market Manipulation & Their Impact (2022)
- Understanding Order Imbalance Effects on Markets (2022)
This comprehensive overview aims not only at clarifying technical differences but also providing practical insights aligned with user intent—helping both novice investors learn foundational concepts while offering seasoned traders nuanced considerations based on recent trends.*
免责声明:含第三方内容,非财务建议。
详见《条款和条件》
What Is Trading Sentiment? A Complete Guide
Understanding Trading Sentiment and Its Role in Financial Markets
Trading sentiment refers to the overall attitude or emotional state of investors and traders toward a particular asset, market, or the economy as a whole. It reflects collective feelings—whether optimistic, pessimistic, or neutral—that influence buying and selling decisions. Unlike fundamental analysis, which examines financial data and economic indicators, sentiment analysis focuses on psychological factors that can drive short-term market movements.
Market participants’ emotions often lead to behaviors such as overbuying during bullish phases or panic selling during downturns. Recognizing these patterns can help traders anticipate potential reversals or continuations in price trends. This makes trading sentiment an essential component for investors aiming to understand not just what is happening but why it is happening in the markets.
How Trading Sentiment Is Measured
There are several methods used to gauge market sentiment accurately:
- Technical Indicators: Tools like Relative Strength Index (RSI), Bollinger Bands, and moving averages help identify overbought or oversold conditions that signal potential shifts in investor mood.
- Fundamental Data with a Sentiment Twist: While traditional fundamental analysis looks at earnings reports and economic data, incorporating qualitative factors such as news headlines and social media trends provides insights into prevailing investor attitudes.
- Sentiment Surveys & Reports: Investor surveys conducted by financial institutions reveal how bullish or bearish market participants feel about specific assets.
- Social Media & News Analysis: Monitoring platforms like Twitter, Reddit forums, and news outlets allows analysts to assess real-time emotional responses from traders worldwide.
The Psychology Behind Market Movements
Market psychology plays a pivotal role in shaping trading sentiment. Emotions such as fear and greed often dominate decision-making processes more than rational evaluation of assets' intrinsic value. For example:
- During bullish periods driven by optimism, investors tend to buy aggressively—sometimes leading to overvaluation.
- Conversely, widespread fear during downturns can trigger mass sell-offs even when fundamentals remain strong.
This collective behavior creates feedback loops where positive sentiment fuels further gains while negative sentiments accelerate declines. Recognizing these psychological patterns helps traders avoid herd mentality pitfalls while capitalizing on emerging opportunities.
Recent Trends Impacting Trading Sentiment
In recent months leading up to 2025's mid-year point, global markets have experienced mixed sentiments influenced by macroeconomic uncertainties. Stock indices across Asia showed caution amid geopolitical tensions; meanwhile U.S.-based stocks faced volatility due to inflation concerns and policy adjustments by central banks.
Specific company performances also reflect shifting investor attitudes:
Webull’s stock experienced a decline following mixed technical signals despite strategic partnerships like Visa integration—highlighting cautious investor behavior amid uncertain prospects.
BioPlus Acquisition Corp.'s delisting fears caused bearish sentiments among shareholders due to regulatory risks impacting its future viability.
Additionally, biotech firms like Spero Therapeutics faced negative market reactions ahead of quarterly earnings releases—a typical scenario where short-term sentiment influences trading volume more than long-term fundamentals.
The Impact of Market Sentiment on Investment Strategies
Understanding current trading sentiment enables investors to make more informed decisions:
- Timing Entry & Exit Points: By analyzing indicators signaling overbought/oversold conditions alongside qualitative data from news sources,traders can better time their trades.
- Risk Management: Recognizing signs of heightened volatility driven by negative sentiment helps mitigate losses through stop-loss ordersor hedging strategies.
- Contrarian Investing: Sometimes extreme negativity presents buying opportunities if underlying fundamentals remain strong,allowing contrarians to capitalize on eventual rebounds.
- Market Volatility Prediction: Sudden shifts in collective mood often precede sharp price swings; monitoring these cues aids in preparing for rapid changes.
Potential Risks Associated With Overreliance on Sentiment Analysis
While valuable tools for understanding market dynamics,
overdependence on trading sentiment alone carries risks:
It may lead traders astray if emotional reactions are mistaken for genuine trend reversals,resulting in premature entries/exits.
Market noise—short-term fluctuations driven purely by emotion rather than fundamentals—can cause false signals,leading investors into costly mistakes without proper confirmation from other analyses.
Therefore,
combining sentiment insights with technical and fundamental research ensures a balanced approach aligned with sound investment principles.
How Traders Can Use Sentiment Data Effectively
To leverage trading sentiment effectively,
investors should adopt best practices:
- Regularly monitor multiple sources including technical indicators,social media trends,and news headlinesto get comprehensive views of current moods.
- Use quantitative models that incorporate both numerical data (like RSI levels) and qualitative inputs (such as analyst opinions).
- Stay aware of broader macroeconomic developments influencing overall investor confidence,such as interest rate changes or geopolitical events.
- Maintain discipline by avoiding impulsive trades based solely on fleeting emotions;instead,
wait for confirmation signals before acting.
Why Understanding Trading Sentiment Matters for Investors Today
In an era characterized by rapid information flow facilitated through digital platforms,
market psychology has become more influential than ever before. The rise of social media has amplified individual voices contributing collectively toward heightened volatility episodes—notably seen during recent crypto booms/busts
or meme-stock rallies where crowd behavior drove prices far beyond intrinsic values temporarily.
For professional investors seeking an edge,
integrating real-time sentiment analysis enhances their ability to navigate complex environments effectively while managing risk appropriately.
Final Thoughts
Trading sentiment offers invaluable insights into the emotional undercurrents shaping financial markets today—from stocks and cryptocurrencies to commodities and forex pairs . By understanding how collective feelings influence price movements—and utilizing various measurement tools—traders gain an advantage that complements traditional analytical methods .
As markets continue evolving amidst technological advancements
staying attuned not only to hard data but also human psychology remains crucial for making informed investment choices — especially when navigating periods marked by uncertainty or high volatility
JCUSER-WVMdslBw
2025-05-15 03:22
What is trading sentiment?
What Is Trading Sentiment? A Complete Guide
Understanding Trading Sentiment and Its Role in Financial Markets
Trading sentiment refers to the overall attitude or emotional state of investors and traders toward a particular asset, market, or the economy as a whole. It reflects collective feelings—whether optimistic, pessimistic, or neutral—that influence buying and selling decisions. Unlike fundamental analysis, which examines financial data and economic indicators, sentiment analysis focuses on psychological factors that can drive short-term market movements.
Market participants’ emotions often lead to behaviors such as overbuying during bullish phases or panic selling during downturns. Recognizing these patterns can help traders anticipate potential reversals or continuations in price trends. This makes trading sentiment an essential component for investors aiming to understand not just what is happening but why it is happening in the markets.
How Trading Sentiment Is Measured
There are several methods used to gauge market sentiment accurately:
- Technical Indicators: Tools like Relative Strength Index (RSI), Bollinger Bands, and moving averages help identify overbought or oversold conditions that signal potential shifts in investor mood.
- Fundamental Data with a Sentiment Twist: While traditional fundamental analysis looks at earnings reports and economic data, incorporating qualitative factors such as news headlines and social media trends provides insights into prevailing investor attitudes.
- Sentiment Surveys & Reports: Investor surveys conducted by financial institutions reveal how bullish or bearish market participants feel about specific assets.
- Social Media & News Analysis: Monitoring platforms like Twitter, Reddit forums, and news outlets allows analysts to assess real-time emotional responses from traders worldwide.
The Psychology Behind Market Movements
Market psychology plays a pivotal role in shaping trading sentiment. Emotions such as fear and greed often dominate decision-making processes more than rational evaluation of assets' intrinsic value. For example:
- During bullish periods driven by optimism, investors tend to buy aggressively—sometimes leading to overvaluation.
- Conversely, widespread fear during downturns can trigger mass sell-offs even when fundamentals remain strong.
This collective behavior creates feedback loops where positive sentiment fuels further gains while negative sentiments accelerate declines. Recognizing these psychological patterns helps traders avoid herd mentality pitfalls while capitalizing on emerging opportunities.
Recent Trends Impacting Trading Sentiment
In recent months leading up to 2025's mid-year point, global markets have experienced mixed sentiments influenced by macroeconomic uncertainties. Stock indices across Asia showed caution amid geopolitical tensions; meanwhile U.S.-based stocks faced volatility due to inflation concerns and policy adjustments by central banks.
Specific company performances also reflect shifting investor attitudes:
Webull’s stock experienced a decline following mixed technical signals despite strategic partnerships like Visa integration—highlighting cautious investor behavior amid uncertain prospects.
BioPlus Acquisition Corp.'s delisting fears caused bearish sentiments among shareholders due to regulatory risks impacting its future viability.
Additionally, biotech firms like Spero Therapeutics faced negative market reactions ahead of quarterly earnings releases—a typical scenario where short-term sentiment influences trading volume more than long-term fundamentals.
The Impact of Market Sentiment on Investment Strategies
Understanding current trading sentiment enables investors to make more informed decisions:
- Timing Entry & Exit Points: By analyzing indicators signaling overbought/oversold conditions alongside qualitative data from news sources,traders can better time their trades.
- Risk Management: Recognizing signs of heightened volatility driven by negative sentiment helps mitigate losses through stop-loss ordersor hedging strategies.
- Contrarian Investing: Sometimes extreme negativity presents buying opportunities if underlying fundamentals remain strong,allowing contrarians to capitalize on eventual rebounds.
- Market Volatility Prediction: Sudden shifts in collective mood often precede sharp price swings; monitoring these cues aids in preparing for rapid changes.
Potential Risks Associated With Overreliance on Sentiment Analysis
While valuable tools for understanding market dynamics,
overdependence on trading sentiment alone carries risks:
It may lead traders astray if emotional reactions are mistaken for genuine trend reversals,resulting in premature entries/exits.
Market noise—short-term fluctuations driven purely by emotion rather than fundamentals—can cause false signals,leading investors into costly mistakes without proper confirmation from other analyses.
Therefore,
combining sentiment insights with technical and fundamental research ensures a balanced approach aligned with sound investment principles.
How Traders Can Use Sentiment Data Effectively
To leverage trading sentiment effectively,
investors should adopt best practices:
- Regularly monitor multiple sources including technical indicators,social media trends,and news headlinesto get comprehensive views of current moods.
- Use quantitative models that incorporate both numerical data (like RSI levels) and qualitative inputs (such as analyst opinions).
- Stay aware of broader macroeconomic developments influencing overall investor confidence,such as interest rate changes or geopolitical events.
- Maintain discipline by avoiding impulsive trades based solely on fleeting emotions;instead,
wait for confirmation signals before acting.
Why Understanding Trading Sentiment Matters for Investors Today
In an era characterized by rapid information flow facilitated through digital platforms,
market psychology has become more influential than ever before. The rise of social media has amplified individual voices contributing collectively toward heightened volatility episodes—notably seen during recent crypto booms/busts
or meme-stock rallies where crowd behavior drove prices far beyond intrinsic values temporarily.
For professional investors seeking an edge,
integrating real-time sentiment analysis enhances their ability to navigate complex environments effectively while managing risk appropriately.
Final Thoughts
Trading sentiment offers invaluable insights into the emotional undercurrents shaping financial markets today—from stocks and cryptocurrencies to commodities and forex pairs . By understanding how collective feelings influence price movements—and utilizing various measurement tools—traders gain an advantage that complements traditional analytical methods .
As markets continue evolving amidst technological advancements
staying attuned not only to hard data but also human psychology remains crucial for making informed investment choices — especially when navigating periods marked by uncertainty or high volatility
免责声明:含第三方内容,非财务建议。
详见《条款和条件》
What is the Funding Rate in Perpetual Futures?
The funding rate is a fundamental concept in perpetual futures trading, especially within cryptocurrency markets. It acts as a mechanism to keep the price of perpetual contracts aligned with the underlying asset's spot price. Unlike traditional futures, which have fixed expiration dates, perpetual futures are designed to trade indefinitely. This unique feature necessitates a system—namely, the funding rate—to maintain market stability and liquidity over time.
In essence, the funding rate represents periodic payments exchanged between traders holding long and short positions based on prevailing market conditions. When used correctly, it helps prevent significant deviations between the futures contract price and the actual market value of the underlying asset.
How Does the Funding Rate Work?
The primary purpose of the funding rate is to balance supply and demand within perpetual futures markets. It operates on a regular schedule—often every 8 hours—where traders either pay or receive fees depending on their position type (long or short) and current market dynamics.
If traders collectively believe that prices will rise above spot prices, long positions tend to dominate. To prevent excessive divergence from real-world prices, exchanges implement a positive funding rate where longs pay shorts periodically. Conversely, if futures prices fall below spot prices due to bearish sentiment or other factors, negative funding rates may occur where shorts pay longs.
This payment flow incentivizes traders' behavior: high positive rates encourage some longs to close their positions or take profits while attracting more shorts; negative rates do just the opposite by encouraging longs to hold onto their positions despite unfavorable conditions.
Calculation of Funding Rates
Understanding how funding rates are calculated provides insight into their role in maintaining equilibrium:
- Basis Difference: The core component involves calculating the difference between current spot prices and futures contract prices.
- Interest Rate Component: Some models incorporate an interest component reflecting borrowing costs.
- Premium/Discount Adjustment: The calculation considers whether contracts are trading at a premium (above spot) or discount (below spot).
Most exchanges compute this rate every 8 hours using real-time data from both markets. The formula varies slightly across platforms but generally follows this pattern:
Funding Rate = (Futures Price - Spot Price) / Spot Price * Adjustment FactorWhere adjustments account for interest rates and other market factors specific to each exchange’s methodology.
Why Is The Funding Rate Important for Traders?
For traders engaged in perpetual futures trading, understanding how funding impacts profitability is crucial:
- Cost Management: A positive funding rate means holding long positions incurs periodic costs; negative rates mean short sellers face similar charges.
- Strategy Planning: Anticipating changes in fundings can influence entry/exit points—for example, avoiding entering new long positions when high positive rates are expected.
- Risk Control: Sudden spikes or drops in fundings often signal shifts in market sentiment or volatility; monitoring these can help mitigate potential losses.
Moreover, since these payments happen automatically at scheduled intervals through exchange mechanisms like wallet deductions or credits, they directly affect net gains/losses over time.
Impact of Market Volatility on Funding Rates
Market volatility significantly influences how often and how drastically funding rates fluctuate:
- During periods of rapid price swings—such as during major news events—the spread between spot and future prices widens temporarily.
- These fluctuations cause corresponding jumps in financing costs for traders holding open positions.
- High volatility environments often see increased frequency of large positive or negative fundings as markets attempt self-correction mechanisms quickly respond to changing sentiments.
Such dynamics underscore why active monitoring becomes essential during turbulent times—they can dramatically alter profitability prospects for leveraged trades.
Regulatory Changes Affecting Funding Rates
Regulatory developments also play an influential role by shaping overall market sentiment—and consequently impacting funds' flow patterns:
- New rules around derivatives trading may impose restrictions that influence leverage limits,
- Changes requiring greater transparency could lead exchanges to modify calculation methods,
- Regulatory crackdowns might reduce overall trading activity affecting liquidity levels,
These factors indirectly impact how frequently and intensely funds change hands via differentials like those seen through varying funding rates across jurisdictions.
Risks Associated with Funding Rates
While beneficial for maintaining equilibrium under normal conditions,
extreme scenarios involving abnormal fundings pose risks such as:
- Market Destabilization: Excessively high positive/negative fundings may trigger mass liquidations if traders cannot sustain costs,
- Manipulation Potential: Some actors might attempt strategies exploiting predictable patterns within fee calculations,
- Trader Behavior Shifts: Unexpected changes could lead investors toward riskier behaviors like overleveraging before adverse shifts occur,
Therefore, prudent risk management practices—including setting stop-loss orders—is vital when operating under volatile conditions influenced by fluctuating fundings.
By grasping what determines your costs related to persistent holdings—and recognizing broader influences such as volatility trends—they become invaluable tools for informed decision-making within cryptocurrency derivatives markets.
Key Takeaways:
- The funding rate aligns perpetual contract pricing with underlying assets’ real-time values.
- Calculated regularly based on premium/discounts relative to spot prices.
- Impacts trader profitability directly through periodic payments.
- Fluctuates with market volatility & regulatory environment changes.
Staying aware of these dynamics enhances strategic planning—whether you're hedging risks or seeking arbitrage opportunities—in today’s fast-paced crypto landscape.
Semantic & LSI Keywords:
Perpetual swaps | Cryptocurrency derivatives | Futures contract pricing | Market liquidity | Trading fees | Leverage trading | Crypto regulation impacts | Volatility effects on derivatives
kai
2025-05-09 16:09
What is the funding rate in perpetual futures?
What is the Funding Rate in Perpetual Futures?
The funding rate is a fundamental concept in perpetual futures trading, especially within cryptocurrency markets. It acts as a mechanism to keep the price of perpetual contracts aligned with the underlying asset's spot price. Unlike traditional futures, which have fixed expiration dates, perpetual futures are designed to trade indefinitely. This unique feature necessitates a system—namely, the funding rate—to maintain market stability and liquidity over time.
In essence, the funding rate represents periodic payments exchanged between traders holding long and short positions based on prevailing market conditions. When used correctly, it helps prevent significant deviations between the futures contract price and the actual market value of the underlying asset.
How Does the Funding Rate Work?
The primary purpose of the funding rate is to balance supply and demand within perpetual futures markets. It operates on a regular schedule—often every 8 hours—where traders either pay or receive fees depending on their position type (long or short) and current market dynamics.
If traders collectively believe that prices will rise above spot prices, long positions tend to dominate. To prevent excessive divergence from real-world prices, exchanges implement a positive funding rate where longs pay shorts periodically. Conversely, if futures prices fall below spot prices due to bearish sentiment or other factors, negative funding rates may occur where shorts pay longs.
This payment flow incentivizes traders' behavior: high positive rates encourage some longs to close their positions or take profits while attracting more shorts; negative rates do just the opposite by encouraging longs to hold onto their positions despite unfavorable conditions.
Calculation of Funding Rates
Understanding how funding rates are calculated provides insight into their role in maintaining equilibrium:
- Basis Difference: The core component involves calculating the difference between current spot prices and futures contract prices.
- Interest Rate Component: Some models incorporate an interest component reflecting borrowing costs.
- Premium/Discount Adjustment: The calculation considers whether contracts are trading at a premium (above spot) or discount (below spot).
Most exchanges compute this rate every 8 hours using real-time data from both markets. The formula varies slightly across platforms but generally follows this pattern:
Funding Rate = (Futures Price - Spot Price) / Spot Price * Adjustment FactorWhere adjustments account for interest rates and other market factors specific to each exchange’s methodology.
Why Is The Funding Rate Important for Traders?
For traders engaged in perpetual futures trading, understanding how funding impacts profitability is crucial:
- Cost Management: A positive funding rate means holding long positions incurs periodic costs; negative rates mean short sellers face similar charges.
- Strategy Planning: Anticipating changes in fundings can influence entry/exit points—for example, avoiding entering new long positions when high positive rates are expected.
- Risk Control: Sudden spikes or drops in fundings often signal shifts in market sentiment or volatility; monitoring these can help mitigate potential losses.
Moreover, since these payments happen automatically at scheduled intervals through exchange mechanisms like wallet deductions or credits, they directly affect net gains/losses over time.
Impact of Market Volatility on Funding Rates
Market volatility significantly influences how often and how drastically funding rates fluctuate:
- During periods of rapid price swings—such as during major news events—the spread between spot and future prices widens temporarily.
- These fluctuations cause corresponding jumps in financing costs for traders holding open positions.
- High volatility environments often see increased frequency of large positive or negative fundings as markets attempt self-correction mechanisms quickly respond to changing sentiments.
Such dynamics underscore why active monitoring becomes essential during turbulent times—they can dramatically alter profitability prospects for leveraged trades.
Regulatory Changes Affecting Funding Rates
Regulatory developments also play an influential role by shaping overall market sentiment—and consequently impacting funds' flow patterns:
- New rules around derivatives trading may impose restrictions that influence leverage limits,
- Changes requiring greater transparency could lead exchanges to modify calculation methods,
- Regulatory crackdowns might reduce overall trading activity affecting liquidity levels,
These factors indirectly impact how frequently and intensely funds change hands via differentials like those seen through varying funding rates across jurisdictions.
Risks Associated with Funding Rates
While beneficial for maintaining equilibrium under normal conditions,
extreme scenarios involving abnormal fundings pose risks such as:
- Market Destabilization: Excessively high positive/negative fundings may trigger mass liquidations if traders cannot sustain costs,
- Manipulation Potential: Some actors might attempt strategies exploiting predictable patterns within fee calculations,
- Trader Behavior Shifts: Unexpected changes could lead investors toward riskier behaviors like overleveraging before adverse shifts occur,
Therefore, prudent risk management practices—including setting stop-loss orders—is vital when operating under volatile conditions influenced by fluctuating fundings.
By grasping what determines your costs related to persistent holdings—and recognizing broader influences such as volatility trends—they become invaluable tools for informed decision-making within cryptocurrency derivatives markets.
Key Takeaways:
- The funding rate aligns perpetual contract pricing with underlying assets’ real-time values.
- Calculated regularly based on premium/discounts relative to spot prices.
- Impacts trader profitability directly through periodic payments.
- Fluctuates with market volatility & regulatory environment changes.
Staying aware of these dynamics enhances strategic planning—whether you're hedging risks or seeking arbitrage opportunities—in today’s fast-paced crypto landscape.
Semantic & LSI Keywords:
Perpetual swaps | Cryptocurrency derivatives | Futures contract pricing | Market liquidity | Trading fees | Leverage trading | Crypto regulation impacts | Volatility effects on derivatives
免责声明:含第三方内容,非财务建议。
详见《条款和条件》
What Scripting Language Does MT4 Use?
MetaTrader 4 (MT4) is one of the most popular trading platforms used by retail traders worldwide. Its success largely depends on its powerful automation capabilities, which are enabled through its scripting language. For traders and developers seeking to understand how MT4 supports custom automation and analysis, knowing the underlying scripting language is essential.
Understanding MT4’s Scripting Language: MQL4
At the core of MT4’s automation features lies MQL4 (MetaQuotes Language 4). This specialized programming language was designed specifically for the MetaTrader 4 platform, allowing users to create custom indicators, automated trading strategies known as Expert Advisors (EAs), and scripts that streamline various trading tasks.
MQL4 shares similarities with C++, especially in syntax and structure, but it is tailored for financial market operations within MT4. This means that while programmers familiar with C++ or similar languages will find some common ground, MQL4 has unique functions optimized for chart analysis, order management, and data handling specific to forex trading.
Key Features of MQL4
Understanding what makes MQL4 suitable for trading automation helps clarify why it remains popular among traders:
- Purpose-built: Designed explicitly for creating custom indicators and EAs that can execute trades automatically based on predefined criteria.
- Rich Function Library: Includes a comprehensive set of built-in functions covering order execution (
OrderSend(),OrderClose()), chart manipulation (ObjectCreate(),ChartSetInteger()), data analysis (iMA(),iRSI()), and more. - Event-driven Programming: Supports event handlers such as
OnInit(),OnTick(), which respond to market events in real-time. - Community Support: An active community provides numerous tutorials, shared code libraries, forums, and resources that facilitate learning and development.
Recent Developments in Trading Automation Languages
While MQL4 remains widely used due to its deep integration with MT4's architecture, MetaQuotes Software introduced an upgraded version called MQL5 around 2019. This newer language offers enhanced performance capabilities like multi-threading support and improved object-oriented programming features.
Despite this advancement, many traders continue using MQL2 because their existing systems are built on it or because they prefer its simplicity for certain tasks. The transition from MQL1/2/3 to MQL5 has created some compatibility challenges but also opened doors for more sophisticated algorithmic strategies.
Furthermore, there have been efforts to bridge MT4 with other technologies—such as APIs connecting external data sources or blockchain integrations—broadening the scope of what can be achieved through scripting beyond traditional forex markets.
Security Concerns & Compatibility Challenges
Like any scripting environment used in financial applications involving real money transactions — security becomes a critical concern. Malicious scripts could potentially manipulate trades or leak sensitive information if not properly vetted. As a result:
- Brokers often impose strict guidelines regarding script verification.
- Users should only download scripts from trusted sources.
Additionally, transitioning from older versions like MQL four to newer iterations such as MQL5 introduces compatibility issues:
- Existing libraries may require rewriting or significant modifications.
- Developers need ongoing updates aligned with platform upgrades.
These challenges underscore the importance of understanding both current capabilities and future developments when working within this ecosystem.
The Role of Scripting Languages in Algorithmic Trading
The rise of algorithmic trading has significantly increased reliance on scripting languages like MQL4 due to their ability to automate complex strategies efficiently. Traders leverage these tools not only for executing trades faster than manual methods but also for backtesting strategies against historical data—a crucial step before deploying live algorithms.
While Python has gained popularity across broader financial markets thanks to its extensive libraries (e.g., Pandas & NumPy) — especially outside MetaTrader — many traders still favor MQL4 because it's tightly integrated into their primary trading environment without requiring external connections or additional software layers.
Timeline Highlights
To contextualize the evolution:
- 2005: MetaQuotes Software releases MT۴; initial support includes basic scripting capabilities.
- 2010s: Widespread adoption of custom indicators & EAs using MQ۴; community growth accelerates.
- 2019: Introduction of MQL5, offering advanced features; signals a shift toward more robust development options.
Understanding these milestones helps users appreciate how far automated trading via scripting has come within MetaTrader environments—and why staying updated is vital for effective strategy deployment today.
By grasping what scripting language powers MT4—namely MQL4—traders gain insight into how they can customize their platforms effectively while being aware of ongoing developments like Mql5. Whether you're developing your own expert advisors or analyzing market data through custom indicators, mastering this language enhances your ability to automate decisions confidently within one of the most established forex platforms available today.
kai
2025-05-26 12:53
What scripting language does MT4 use?
What Scripting Language Does MT4 Use?
MetaTrader 4 (MT4) is one of the most popular trading platforms used by retail traders worldwide. Its success largely depends on its powerful automation capabilities, which are enabled through its scripting language. For traders and developers seeking to understand how MT4 supports custom automation and analysis, knowing the underlying scripting language is essential.
Understanding MT4’s Scripting Language: MQL4
At the core of MT4’s automation features lies MQL4 (MetaQuotes Language 4). This specialized programming language was designed specifically for the MetaTrader 4 platform, allowing users to create custom indicators, automated trading strategies known as Expert Advisors (EAs), and scripts that streamline various trading tasks.
MQL4 shares similarities with C++, especially in syntax and structure, but it is tailored for financial market operations within MT4. This means that while programmers familiar with C++ or similar languages will find some common ground, MQL4 has unique functions optimized for chart analysis, order management, and data handling specific to forex trading.
Key Features of MQL4
Understanding what makes MQL4 suitable for trading automation helps clarify why it remains popular among traders:
- Purpose-built: Designed explicitly for creating custom indicators and EAs that can execute trades automatically based on predefined criteria.
- Rich Function Library: Includes a comprehensive set of built-in functions covering order execution (
OrderSend(),OrderClose()), chart manipulation (ObjectCreate(),ChartSetInteger()), data analysis (iMA(),iRSI()), and more. - Event-driven Programming: Supports event handlers such as
OnInit(),OnTick(), which respond to market events in real-time. - Community Support: An active community provides numerous tutorials, shared code libraries, forums, and resources that facilitate learning and development.
Recent Developments in Trading Automation Languages
While MQL4 remains widely used due to its deep integration with MT4's architecture, MetaQuotes Software introduced an upgraded version called MQL5 around 2019. This newer language offers enhanced performance capabilities like multi-threading support and improved object-oriented programming features.
Despite this advancement, many traders continue using MQL2 because their existing systems are built on it or because they prefer its simplicity for certain tasks. The transition from MQL1/2/3 to MQL5 has created some compatibility challenges but also opened doors for more sophisticated algorithmic strategies.
Furthermore, there have been efforts to bridge MT4 with other technologies—such as APIs connecting external data sources or blockchain integrations—broadening the scope of what can be achieved through scripting beyond traditional forex markets.
Security Concerns & Compatibility Challenges
Like any scripting environment used in financial applications involving real money transactions — security becomes a critical concern. Malicious scripts could potentially manipulate trades or leak sensitive information if not properly vetted. As a result:
- Brokers often impose strict guidelines regarding script verification.
- Users should only download scripts from trusted sources.
Additionally, transitioning from older versions like MQL four to newer iterations such as MQL5 introduces compatibility issues:
- Existing libraries may require rewriting or significant modifications.
- Developers need ongoing updates aligned with platform upgrades.
These challenges underscore the importance of understanding both current capabilities and future developments when working within this ecosystem.
The Role of Scripting Languages in Algorithmic Trading
The rise of algorithmic trading has significantly increased reliance on scripting languages like MQL4 due to their ability to automate complex strategies efficiently. Traders leverage these tools not only for executing trades faster than manual methods but also for backtesting strategies against historical data—a crucial step before deploying live algorithms.
While Python has gained popularity across broader financial markets thanks to its extensive libraries (e.g., Pandas & NumPy) — especially outside MetaTrader — many traders still favor MQL4 because it's tightly integrated into their primary trading environment without requiring external connections or additional software layers.
Timeline Highlights
To contextualize the evolution:
- 2005: MetaQuotes Software releases MT۴; initial support includes basic scripting capabilities.
- 2010s: Widespread adoption of custom indicators & EAs using MQ۴; community growth accelerates.
- 2019: Introduction of MQL5, offering advanced features; signals a shift toward more robust development options.
Understanding these milestones helps users appreciate how far automated trading via scripting has come within MetaTrader environments—and why staying updated is vital for effective strategy deployment today.
By grasping what scripting language powers MT4—namely MQL4—traders gain insight into how they can customize their platforms effectively while being aware of ongoing developments like Mql5. Whether you're developing your own expert advisors or analyzing market data through custom indicators, mastering this language enhances your ability to automate decisions confidently within one of the most established forex platforms available today.
免责声明:含第三方内容,非财务建议。
详见《条款和条件》
Psychological Pitfalls of Trading: Understanding the Hidden Risks
Trading in financial markets—whether traditional stocks, forex, or cryptocurrencies—is as much a psychological challenge as it is a financial one. While many traders focus on technical analysis, market trends, and economic indicators, the human mind often introduces biases and emotional reactions that can undermine even the most well-planned strategies. Recognizing these psychological pitfalls is essential for anyone looking to improve their trading performance and safeguard their investments.
Common Psychological Biases That Affect Traders
Human cognition is prone to several biases that can distort decision-making during trading activities. These biases often operate subconsciously but have tangible impacts on trading outcomes.
Confirmation Bias
Confirmation bias occurs when traders seek out information that supports their existing beliefs while ignoring evidence that contradicts them. For example, a trader convinced that a particular stock will rise might only pay attention to positive news and dismiss negative signals. This selective perception can lead to holding onto losing positions longer than advisable or doubling down on flawed assumptions.
Loss Aversion
Loss aversion describes the tendency for individuals to prefer avoiding losses over acquiring equivalent gains. In practical terms, traders may hold onto losing assets in hopes of recovery or hesitate to cut losses early due to fear of realizing a loss. This behavior often results in larger-than-necessary losses and hampers portfolio performance.
Overconfidence
Overconfidence manifests when traders overestimate their abilities or knowledge about market movements. Such overconfidence can lead to excessive risk-taking—like investing large sums without proper analysis—or neglecting risk management tools such as stop-loss orders. When predictions fail, overconfident traders are more likely to suffer significant setbacks.
Herding Behavior
Herding involves following the crowd rather than relying on independent analysis. During periods of market euphoria or panic, many investors buy or sell en masse based solely on collective sentiment rather than fundamentals. This behavior amplifies volatility and can cause bubbles or crashes driven by emotional contagion rather than intrinsic value.
Emotional Trading: Fear and Greed
Emotions play a pivotal role in trading decisions; fear prompts premature selling during downturns while greed encourages chasing after quick profits during peaks. Both extremes lead to impulsive actions—selling at lows or buying at highs—that deviate from rational strategies rooted in analysis.
Cognitive Biases Impacting Trading Decisions
Beyond common biases like confirmation bias and herding behavior, other cognitive distortions influence how traders interpret information:
- Anchoring Bias: Relying heavily on initial data points (such as first impressions about an asset) can skew future expectations.
- Framing Effect: The way information is presented influences decisions; positive framing tends to encourage risk-taking whereas negative framing fosters caution.
- Availability Heuristic: Recent vivid events (like sudden crashes) disproportionately impact judgment about future risks.
- Hindsight Bias: After an event occurs, traders may believe they "knew it all along," leading to unwarranted confidence in predictive abilities.
- Regret Aversion: To avoid feelings of regret from making wrong choices—such as selling too early—traders might cling onto losing positions longer than optimal.
Understanding these biases helps investors develop awareness around subconscious influences affecting their trades.
Recent Trends Amplifying Psychological Challenges
The landscape of trading has evolved rapidly with technological advances and social dynamics adding new layers of complexity:
Cryptocurrency Market Volatility
Cryptocurrencies are notorious for extreme price swings driven by speculative interest rather than fundamental valuation metrics. This volatility intensifies emotional responses like greed during rallies and panic during declines — fueling impulsive trades based more on sentiment than strategy.
Influence of Social Media
Platforms like Twitter Reddit have democratized access but also amplified herd mentality through viral posts and influencer opinions without thorough vetting processes. Rapid dissemination of rumors or hype can trigger swift market moves disconnected from underlying fundamentals—a phenomenon known as "social media-driven herding."
Technological Innovations & AI Tools
While algorithmic trading offers sophisticated insights, reliance solely on automated systems may reinforce existing biases if not used critically by humans overseeing them properly — potentially leading toward overconfidence in machine-generated signals instead of fundamental analysis.
Educational Initiatives & Behavioral Finance Awareness
Growing efforts aim at improving trader education regarding behavioral finance principles help mitigate some psychological pitfalls by fostering better self-awareness among investors about their cognitive tendencies.
Potential Consequences for Traders & Markets
Failing to recognize psychological pitfalls doesn't just affect individual portfolios—it has broader implications:
- Financial Losses: Poor decision-making rooted in bias leads directly to suboptimal trades resulting in monetary setbacks.
- Market Instability: Collective herding behaviors contribute significantly toward bubbles bursting or sudden crashes due purely from mass psychology rather than economic fundamentals.
- Regulatory Scrutiny: As markets become more volatile due partly to behavioral factors—and sometimes manipulative practices—regulators increase oversight which could impose restrictions impacting trader flexibility.4.. Reputation Damage:** Consistent poor decisions influenced by psychological flaws diminish credibility within professional circles; this affects future opportunities with clients/investors.5.. Mental Health Concerns:** Persistent stress stemming from volatile markets combined with financial losses heightens risks related mental health issues such as anxiety disorders or burnout among active traders.
Strategies To Mitigate Psychological Risks
Awareness alone isn't enough; implementing practical measures helps manage these inherent biases:
- Develop disciplined routines including setting predefined entry/exit points using stop-loss orders.
- Maintain realistic expectations aligned with your risk tolerance levels.
- Regularly review past trades objectively without self-blame but focusing instead on learning opportunities.
- Use journaling techniques for tracking emotions alongside trade decisions—to identify patterns linked with specific biases.
- Seek educational resources focused specifically on behavioral finance principles tailored for active investors.
By understanding both personal psychology and external influences shaping markets today—from social media trends through technological advancements—you position yourself better against common pitfalls that threaten long-term success.
Final Thoughts
Navigating the complex world of trading requires more than just technical skills—it demands keen awareness of your own mental state alongside continuous education about behavioral tendencies influencing decision-making processes . Recognizing prevalent cognitive biases like confirmation bias , loss aversion , herding behavior , along with managing emotions such as fear greed , forms part essential foundation towards becoming a resilient investor capable not only surviving but thriving amid market uncertainties . Staying informed about recent developments—from cryptocurrency volatility through social media impacts—and adopting sound strategies ensures you remain adaptive while minimizing detrimental effects caused by subconscious errors inherent within human nature itself
Lo
2025-05-09 16:14
What are the psychological pitfalls of trading?
Psychological Pitfalls of Trading: Understanding the Hidden Risks
Trading in financial markets—whether traditional stocks, forex, or cryptocurrencies—is as much a psychological challenge as it is a financial one. While many traders focus on technical analysis, market trends, and economic indicators, the human mind often introduces biases and emotional reactions that can undermine even the most well-planned strategies. Recognizing these psychological pitfalls is essential for anyone looking to improve their trading performance and safeguard their investments.
Common Psychological Biases That Affect Traders
Human cognition is prone to several biases that can distort decision-making during trading activities. These biases often operate subconsciously but have tangible impacts on trading outcomes.
Confirmation Bias
Confirmation bias occurs when traders seek out information that supports their existing beliefs while ignoring evidence that contradicts them. For example, a trader convinced that a particular stock will rise might only pay attention to positive news and dismiss negative signals. This selective perception can lead to holding onto losing positions longer than advisable or doubling down on flawed assumptions.
Loss Aversion
Loss aversion describes the tendency for individuals to prefer avoiding losses over acquiring equivalent gains. In practical terms, traders may hold onto losing assets in hopes of recovery or hesitate to cut losses early due to fear of realizing a loss. This behavior often results in larger-than-necessary losses and hampers portfolio performance.
Overconfidence
Overconfidence manifests when traders overestimate their abilities or knowledge about market movements. Such overconfidence can lead to excessive risk-taking—like investing large sums without proper analysis—or neglecting risk management tools such as stop-loss orders. When predictions fail, overconfident traders are more likely to suffer significant setbacks.
Herding Behavior
Herding involves following the crowd rather than relying on independent analysis. During periods of market euphoria or panic, many investors buy or sell en masse based solely on collective sentiment rather than fundamentals. This behavior amplifies volatility and can cause bubbles or crashes driven by emotional contagion rather than intrinsic value.
Emotional Trading: Fear and Greed
Emotions play a pivotal role in trading decisions; fear prompts premature selling during downturns while greed encourages chasing after quick profits during peaks. Both extremes lead to impulsive actions—selling at lows or buying at highs—that deviate from rational strategies rooted in analysis.
Cognitive Biases Impacting Trading Decisions
Beyond common biases like confirmation bias and herding behavior, other cognitive distortions influence how traders interpret information:
- Anchoring Bias: Relying heavily on initial data points (such as first impressions about an asset) can skew future expectations.
- Framing Effect: The way information is presented influences decisions; positive framing tends to encourage risk-taking whereas negative framing fosters caution.
- Availability Heuristic: Recent vivid events (like sudden crashes) disproportionately impact judgment about future risks.
- Hindsight Bias: After an event occurs, traders may believe they "knew it all along," leading to unwarranted confidence in predictive abilities.
- Regret Aversion: To avoid feelings of regret from making wrong choices—such as selling too early—traders might cling onto losing positions longer than optimal.
Understanding these biases helps investors develop awareness around subconscious influences affecting their trades.
Recent Trends Amplifying Psychological Challenges
The landscape of trading has evolved rapidly with technological advances and social dynamics adding new layers of complexity:
Cryptocurrency Market Volatility
Cryptocurrencies are notorious for extreme price swings driven by speculative interest rather than fundamental valuation metrics. This volatility intensifies emotional responses like greed during rallies and panic during declines — fueling impulsive trades based more on sentiment than strategy.
Influence of Social Media
Platforms like Twitter Reddit have democratized access but also amplified herd mentality through viral posts and influencer opinions without thorough vetting processes. Rapid dissemination of rumors or hype can trigger swift market moves disconnected from underlying fundamentals—a phenomenon known as "social media-driven herding."
Technological Innovations & AI Tools
While algorithmic trading offers sophisticated insights, reliance solely on automated systems may reinforce existing biases if not used critically by humans overseeing them properly — potentially leading toward overconfidence in machine-generated signals instead of fundamental analysis.
Educational Initiatives & Behavioral Finance Awareness
Growing efforts aim at improving trader education regarding behavioral finance principles help mitigate some psychological pitfalls by fostering better self-awareness among investors about their cognitive tendencies.
Potential Consequences for Traders & Markets
Failing to recognize psychological pitfalls doesn't just affect individual portfolios—it has broader implications:
- Financial Losses: Poor decision-making rooted in bias leads directly to suboptimal trades resulting in monetary setbacks.
- Market Instability: Collective herding behaviors contribute significantly toward bubbles bursting or sudden crashes due purely from mass psychology rather than economic fundamentals.
- Regulatory Scrutiny: As markets become more volatile due partly to behavioral factors—and sometimes manipulative practices—regulators increase oversight which could impose restrictions impacting trader flexibility.4.. Reputation Damage:** Consistent poor decisions influenced by psychological flaws diminish credibility within professional circles; this affects future opportunities with clients/investors.5.. Mental Health Concerns:** Persistent stress stemming from volatile markets combined with financial losses heightens risks related mental health issues such as anxiety disorders or burnout among active traders.
Strategies To Mitigate Psychological Risks
Awareness alone isn't enough; implementing practical measures helps manage these inherent biases:
- Develop disciplined routines including setting predefined entry/exit points using stop-loss orders.
- Maintain realistic expectations aligned with your risk tolerance levels.
- Regularly review past trades objectively without self-blame but focusing instead on learning opportunities.
- Use journaling techniques for tracking emotions alongside trade decisions—to identify patterns linked with specific biases.
- Seek educational resources focused specifically on behavioral finance principles tailored for active investors.
By understanding both personal psychology and external influences shaping markets today—from social media trends through technological advancements—you position yourself better against common pitfalls that threaten long-term success.
Final Thoughts
Navigating the complex world of trading requires more than just technical skills—it demands keen awareness of your own mental state alongside continuous education about behavioral tendencies influencing decision-making processes . Recognizing prevalent cognitive biases like confirmation bias , loss aversion , herding behavior , along with managing emotions such as fear greed , forms part essential foundation towards becoming a resilient investor capable not only surviving but thriving amid market uncertainties . Staying informed about recent developments—from cryptocurrency volatility through social media impacts—and adopting sound strategies ensures you remain adaptive while minimizing detrimental effects caused by subconscious errors inherent within human nature itself
免责声明:含第三方内容,非财务建议。
详见《条款和条件》
What Is Slippage in Trading? A Complete Guide
Understanding slippage is essential for anyone involved in financial trading, especially within the volatile world of cryptocurrencies. It can significantly influence trade outcomes and overall investment performance. This guide aims to clarify what slippage is, why it occurs, its different types, and how traders can manage it effectively.
Defining Slippage in Financial Markets
Slippage refers to the difference between the expected price of a trade and the actual price at which that trade gets executed. When traders place an order—whether it's a market order or a limit order—they anticipate buying or selling at a specific price point. However, due to rapid market movements or technical factors, the execution often happens at a different price.
This discrepancy can be positive (favorable) or negative (unfavorable). For example, if you intend to buy Bitcoin at $30,000 but your order executes at $30,050 due to sudden market movement, you've experienced negative slippage. Conversely, if your buy occurs at $29,950 during rapid upward movement before your order fills—this is positive slippage.
In essence, slippage reflects real-world trading conditions where prices are constantly changing. While common across all markets—including stocks and forex—it becomes particularly prominent in cryptocurrency markets because of their high volatility and 24/7 trading environment.
Why Does Slippage Happen?
Slippage primarily results from delays between placing an order and its execution—a phenomenon known as "order latency." During this interval:
- Market prices may shift rapidly due to news events or macroeconomic developments.
- Liquidity levels might fluctuate unexpectedly.
- Technical issues on exchanges can cause delays.
In highly liquid markets with stable prices and fast execution speeds—such as major stock exchanges—slippage tends to be minimal. However, in less liquid assets or during periods of extreme volatility like crypto crashes or pump-and-dump schemes—the likelihood of significant slippage increases substantially.
Additionally, certain factors contribute more directly:
- Market Volatility: Sudden spikes in asset prices make it difficult for orders to fill exactly as intended.
- Liquidity Levels: Low liquidity means fewer buyers/sellers are available; even small trades can cause large price swings.
- Order Execution Speed: Faster systems reduce time lag but often come with higher costs; slower systems increase exposure to adverse price movements.
Understanding these causes helps traders develop strategies that mitigate potential losses caused by unfavorable slippages.
Types of Slippage Explained
Different forms of slippage impact traders differently depending on their strategies and market conditions:
Market Slippage
This is the most common type where changes in supply-demand dynamics lead to unexpected execution prices. It’s influenced by overall market activity such as news releases or large trades that move prices quickly up or down.
Liquidity Slipping
Occurs when there isn’t enough liquidity for an asset at desired price levels. In thinly traded cryptocurrencies or assets with low volume on exchanges—especially during off-hours—small orders may trigger larger-than-expected moves leading to higher slippages.
Order Execution Delays
Technical issues like exchange overloads during peak times can delay orders from executing promptly—even if market conditions remain stable otherwise—which results in missed opportunities for favorable pricing.
Exchange Fees Impact
Some platforms charge transaction fees that effectively add costs similar to negative slippages when they aren’t accounted for upfront. These fees vary based on volume traded but should be considered part of total transaction costs when assessing potential risks.
How Market Conditions Influence Slippage
Market volatility plays a crucial role: highly volatile environments tend toward increased slippages because prices change rapidly within seconds—or even milliseconds—in cryptocurrency markets like Bitcoin and Ethereum. Similarly,
- Assets with low liquidity are more susceptible since fewer participants mean larger impacts per trade.
Order speed also matters: faster executions generally help minimize adverse effects but may involve higher fees through premium services such as direct API access or high-frequency trading tools designed specifically for institutional investors seeking precision timing.
Traders employing various strategies—including limit orders versus market orders—must understand how each interacts with these factors: limit orders set specific entry/exit points reducing risk but might not fill immediately; meanwhile,market orders prioritize speed over precision—and thus carry greater risk of experiencing unfavorable slipage under turbulent conditions.
Strategies To Minimize Slippage Risks
While some degree of slippage cannot be entirely eliminated given real-time market dynamics—and especially not during extreme volatility—it’s possible for traders to implement measures that reduce its impact:
Use Limit Orders: Instead of executing trades immediately via market orders—which guarantee quick fill but expose you more directly—you specify maximum purchase prices (for buys) or minimum sale prices (for sells). This approach prevents unwanted fills outside your preferred range unless those exact conditions are met.
Trade During High-Liquidity Periods: Avoid placing large trades during off-hours when liquidity drops sharply—for example overnight sessions on less active crypto pairs—to reduce unpredictable swings caused by thin markets.
Employ Advanced Trading Tools: Automated bots equipped with real-time analytics help identify optimal entry/exit points while adjusting dynamically based on current data trends—a technique increasingly used by professional traders seeking efficiency against unpredictable fluctuations.
Monitor Market News & Events: Staying informed about upcoming economic releases—or regulatory announcements affecting cryptocurrencies—is vital since such events often trigger sharp moves resulting in increased slipage risks.
The Role Of Technology & Regulation
Technological advancements have significantly improved how traders manage slipage risks today:
- High-frequency trading algorithms execute thousands of transactions per second,
- Real-time data feeds enable better decision-making,
- Smart contracts within DeFi platforms automatically execute trades once certain criteria are met—all aiming toward minimizing adverse effects related to timing delays and liquidity gaps.
Regulatory developments also influence this landscape; recent rules introduced across jurisdictions aim both at increasing transparency around transaction costs—including hidden fees contributing indirectly towards perceived slipage—and ensuring fairer practices among exchanges which could stabilize some aspects influencing overall trader experience.
Impacts Of Excessive Slipping On Markets And Investors
High levels of unanticipated slipage undermine investor confidence because they introduce unpredictability into expected returns—a critical concern especially amid rising retail participation driven by accessible crypto platforms worldwide:
- Investor Confidence — Persistent unfavorable slips discourage new entrants,
- Market Efficiency — Excessive discrepancies suggest inefficiencies attracting arbitrageurs who exploit these gaps,
- Regulatory Scrutiny — Authorities may impose stricter rules if widespread concerns about transparency arise,
- Innovation Drive — Ongoing need for better risk management tools fuels technological progress within trading ecosystems.
By understanding how these elements interact—with awareness about current trends—you’re better equipped either as individual trader or institutional participant—to navigate complex environments where managing slipage effectively becomes key part of strategic planning.
Final Thoughts
Slippege remains an inherent aspect across all types of financial markets—but particularly pronounced within cryptocurrency spaces due largely due to their unique characteristics like high volatility and continuous operation hours. Recognizing what causes it—from technical delays through liquidity issues—is fundamental for developing effective mitigation techniques such as using limit orders wisely and leveraging advanced technology solutions.
Staying informed about evolving regulations ensures compliance while optimizing operational efficiency amid changing landscapes shaped by innovation efforts like DeFi platforms aiming further transparency around transaction processes will continue shaping future approaches toward managing this critical aspect efficiently.
Lo
2025-05-15 01:12
What is slippage?
What Is Slippage in Trading? A Complete Guide
Understanding slippage is essential for anyone involved in financial trading, especially within the volatile world of cryptocurrencies. It can significantly influence trade outcomes and overall investment performance. This guide aims to clarify what slippage is, why it occurs, its different types, and how traders can manage it effectively.
Defining Slippage in Financial Markets
Slippage refers to the difference between the expected price of a trade and the actual price at which that trade gets executed. When traders place an order—whether it's a market order or a limit order—they anticipate buying or selling at a specific price point. However, due to rapid market movements or technical factors, the execution often happens at a different price.
This discrepancy can be positive (favorable) or negative (unfavorable). For example, if you intend to buy Bitcoin at $30,000 but your order executes at $30,050 due to sudden market movement, you've experienced negative slippage. Conversely, if your buy occurs at $29,950 during rapid upward movement before your order fills—this is positive slippage.
In essence, slippage reflects real-world trading conditions where prices are constantly changing. While common across all markets—including stocks and forex—it becomes particularly prominent in cryptocurrency markets because of their high volatility and 24/7 trading environment.
Why Does Slippage Happen?
Slippage primarily results from delays between placing an order and its execution—a phenomenon known as "order latency." During this interval:
- Market prices may shift rapidly due to news events or macroeconomic developments.
- Liquidity levels might fluctuate unexpectedly.
- Technical issues on exchanges can cause delays.
In highly liquid markets with stable prices and fast execution speeds—such as major stock exchanges—slippage tends to be minimal. However, in less liquid assets or during periods of extreme volatility like crypto crashes or pump-and-dump schemes—the likelihood of significant slippage increases substantially.
Additionally, certain factors contribute more directly:
- Market Volatility: Sudden spikes in asset prices make it difficult for orders to fill exactly as intended.
- Liquidity Levels: Low liquidity means fewer buyers/sellers are available; even small trades can cause large price swings.
- Order Execution Speed: Faster systems reduce time lag but often come with higher costs; slower systems increase exposure to adverse price movements.
Understanding these causes helps traders develop strategies that mitigate potential losses caused by unfavorable slippages.
Types of Slippage Explained
Different forms of slippage impact traders differently depending on their strategies and market conditions:
Market Slippage
This is the most common type where changes in supply-demand dynamics lead to unexpected execution prices. It’s influenced by overall market activity such as news releases or large trades that move prices quickly up or down.
Liquidity Slipping
Occurs when there isn’t enough liquidity for an asset at desired price levels. In thinly traded cryptocurrencies or assets with low volume on exchanges—especially during off-hours—small orders may trigger larger-than-expected moves leading to higher slippages.
Order Execution Delays
Technical issues like exchange overloads during peak times can delay orders from executing promptly—even if market conditions remain stable otherwise—which results in missed opportunities for favorable pricing.
Exchange Fees Impact
Some platforms charge transaction fees that effectively add costs similar to negative slippages when they aren’t accounted for upfront. These fees vary based on volume traded but should be considered part of total transaction costs when assessing potential risks.
How Market Conditions Influence Slippage
Market volatility plays a crucial role: highly volatile environments tend toward increased slippages because prices change rapidly within seconds—or even milliseconds—in cryptocurrency markets like Bitcoin and Ethereum. Similarly,
- Assets with low liquidity are more susceptible since fewer participants mean larger impacts per trade.
Order speed also matters: faster executions generally help minimize adverse effects but may involve higher fees through premium services such as direct API access or high-frequency trading tools designed specifically for institutional investors seeking precision timing.
Traders employing various strategies—including limit orders versus market orders—must understand how each interacts with these factors: limit orders set specific entry/exit points reducing risk but might not fill immediately; meanwhile,market orders prioritize speed over precision—and thus carry greater risk of experiencing unfavorable slipage under turbulent conditions.
Strategies To Minimize Slippage Risks
While some degree of slippage cannot be entirely eliminated given real-time market dynamics—and especially not during extreme volatility—it’s possible for traders to implement measures that reduce its impact:
Use Limit Orders: Instead of executing trades immediately via market orders—which guarantee quick fill but expose you more directly—you specify maximum purchase prices (for buys) or minimum sale prices (for sells). This approach prevents unwanted fills outside your preferred range unless those exact conditions are met.
Trade During High-Liquidity Periods: Avoid placing large trades during off-hours when liquidity drops sharply—for example overnight sessions on less active crypto pairs—to reduce unpredictable swings caused by thin markets.
Employ Advanced Trading Tools: Automated bots equipped with real-time analytics help identify optimal entry/exit points while adjusting dynamically based on current data trends—a technique increasingly used by professional traders seeking efficiency against unpredictable fluctuations.
Monitor Market News & Events: Staying informed about upcoming economic releases—or regulatory announcements affecting cryptocurrencies—is vital since such events often trigger sharp moves resulting in increased slipage risks.
The Role Of Technology & Regulation
Technological advancements have significantly improved how traders manage slipage risks today:
- High-frequency trading algorithms execute thousands of transactions per second,
- Real-time data feeds enable better decision-making,
- Smart contracts within DeFi platforms automatically execute trades once certain criteria are met—all aiming toward minimizing adverse effects related to timing delays and liquidity gaps.
Regulatory developments also influence this landscape; recent rules introduced across jurisdictions aim both at increasing transparency around transaction costs—including hidden fees contributing indirectly towards perceived slipage—and ensuring fairer practices among exchanges which could stabilize some aspects influencing overall trader experience.
Impacts Of Excessive Slipping On Markets And Investors
High levels of unanticipated slipage undermine investor confidence because they introduce unpredictability into expected returns—a critical concern especially amid rising retail participation driven by accessible crypto platforms worldwide:
- Investor Confidence — Persistent unfavorable slips discourage new entrants,
- Market Efficiency — Excessive discrepancies suggest inefficiencies attracting arbitrageurs who exploit these gaps,
- Regulatory Scrutiny — Authorities may impose stricter rules if widespread concerns about transparency arise,
- Innovation Drive — Ongoing need for better risk management tools fuels technological progress within trading ecosystems.
By understanding how these elements interact—with awareness about current trends—you’re better equipped either as individual trader or institutional participant—to navigate complex environments where managing slipage effectively becomes key part of strategic planning.
Final Thoughts
Slippege remains an inherent aspect across all types of financial markets—but particularly pronounced within cryptocurrency spaces due largely due to their unique characteristics like high volatility and continuous operation hours. Recognizing what causes it—from technical delays through liquidity issues—is fundamental for developing effective mitigation techniques such as using limit orders wisely and leveraging advanced technology solutions.
Staying informed about evolving regulations ensures compliance while optimizing operational efficiency amid changing landscapes shaped by innovation efforts like DeFi platforms aiming further transparency around transaction processes will continue shaping future approaches toward managing this critical aspect efficiently.
免责声明:含第三方内容,非财务建议。
详见《条款和条件》
How Do Traders Draw Trendlines Effectively?
Trendlines are a cornerstone of technical analysis, helping traders identify the overall direction of a market and make informed trading decisions. Drawing accurate and meaningful trendlines requires understanding key principles, selecting appropriate points, and combining them with other analytical tools. This guide provides a comprehensive overview of how traders can draw trendlines effectively to enhance their trading strategies.
Understanding the Purpose of Trendlines in Trading
Trendlines serve as visual representations that depict the general movement or momentum of an asset's price over time. They help traders recognize whether a market is trending upward (bullish), downward (bearish), or moving sideways (sideways consolidation). By connecting significant price points, trendlines reveal potential support and resistance levels—areas where prices tend to bounce or reverse.
In volatile markets like cryptocurrencies, trendlines are especially valuable because they simplify complex price data into clear visual cues. They enable traders to stay aligned with prevailing trends rather than reacting impulsively to short-term fluctuations.
Selecting Key Price Points for Drawing Trendlines
The effectiveness of a trendline hinges on choosing the right points on the chart. These points should reflect meaningful reversals or significant moves rather than minor fluctuations or noise.
- Identify Swing Highs and Swing Lows: Look for prominent peaks (swing highs) in an uptrend and troughs (swing lows) in a downtrend.
- Focus on Reversal Points: Select points where the price has reversed direction after touching certain levels—these often indicate strong support or resistance.
- Use Multiple Touchpoints: The more times the price touches or reacts near your drawn line without breaking it significantly, the stronger its validity becomes.
For example, in an uptrend, connect at least two swing lows that align horizontally; similarly, for downtrends, connect swing highs that form consistent peaks.
Connecting Price Points Accurately
Once you've identified key points:
- Draw Smooth Lines: Use your charting tool’s drawing feature to connect these points with straight lines that follow their general trajectory.
- Avoid Overfitting: Don’t force lines through every minor high or low; focus on major reversal points for clarity.
- Adjust as Needed: Markets evolve; be prepared to modify your trendline if new data suggests it no longer accurately reflects current trends.
A well-drawn line should not be jagged but smoothly follow through relevant touchpoints while capturing the overall direction without overcomplicating it.
Validating Trendline Significance
Not all drawn lines hold predictive power; validation is essential:
- Multiple Touchpoints Confirm Strength: A valid trendline typically has at least two touchpoints; three or more reinforce its significance.
- Observe Reactions at Support/Resistance Levels: When prices bounce off these lines consistently before reversing again—this indicates strong support/resistance.
- Look for Breakouts and Fakeouts: A break above/below a trendline signals potential change but requires confirmation through volume spikes or other indicators like RSI divergence to avoid false signals.
Regularly testing your drawn lines against real-time data ensures they remain relevant within changing market conditions.
Using Multiple Time Frames for Better Accuracy
Analyzing charts across different time frames enhances confidence in your trendline analysis:
- Short-term charts (e.g., 15-minute) help identify immediate trends but may be noisy.
- Longer-term charts (e.g., daily/weekly) provide broader context about overall market directions.
Drawing parallel trendlines across multiple time frames allows you to confirm whether short-term movements align with longer-term trends—a practice known as multi-time frame analysis—which increases reliability when making trades based on these lines.
Combining Trendlines With Other Technical Indicators
While powerful alone, combining trendline analysis with other tools improves decision-making accuracy:
- Moving averages can confirm trending directions indicated by slope angles.
- Relative Strength Index (RSI) helps identify overbought/oversold conditions near support/resistance levels suggested by trendlines.
- Bollinger Bands highlight volatility zones around established trends which can signal potential breakouts when combined with breakout from a trendline pattern.
This integrated approach reduces false signals caused by relying solely on one indicator type and aligns well with best practices recommended by experienced traders and analysts who prioritize robust risk management strategies rooted in proven technical methods.
Recent Advances Enhancing Trendline Drawing Techniques
Technological developments have transformed how traders draw and interpret trendlines:
Automation Through Machine Learning & AI
Modern algorithms now assist in automatically identifying key reversal points based on historical data patterns. These systems analyze vast datasets faster than manual methods could allow—and often suggest optimal placement for dynamic adjustment during live trading sessions—improving accuracy especially during volatile periods such as crypto booms like 2017’s surge or sudden crashes like those seen during COVID-related market shocks in 2020.
Social Media & Community Insights
Platforms such as Twitter and Reddit foster collaborative environments where traders share annotated charts highlighting effective ways they’ve drawn reliable trade-supporting lines under various conditions—including crypto markets characterized by rapid swings—thus democratizing access to refined techniques previously reserved for institutional analysts.
Integration With Charting Software
Most modern charting platforms incorporate features allowing users to automate some aspects of drawing multiple parallel channels simultaneously across different timeframes—aiding both novice investors seeking clarity amid chaos—and professional traders aiming for precision execution.
By mastering how to select appropriate key points, connect them accurately using smooth lines, validate their significance through multiple touchpoints—all while leveraging technological advancements—you can significantly improve your ability to draw effective trade-trend indicators. Combining this skill set with other analytical tools will empower you toward more confident decision-making within diverse markets—from stocks and forex currencies to high-volatility cryptocurrencies—and adapt swiftly amidst ever-changing financial landscapes.
Remember, consistent practice coupled with ongoing learning from both traditional techniques and innovative technologies will refine your ability over time—making you better equipped not just today but also prepared for future market shifts.
JCUSER-F1IIaxXA
2025-05-09 03:56
How do traders draw trendlines effectively?
How Do Traders Draw Trendlines Effectively?
Trendlines are a cornerstone of technical analysis, helping traders identify the overall direction of a market and make informed trading decisions. Drawing accurate and meaningful trendlines requires understanding key principles, selecting appropriate points, and combining them with other analytical tools. This guide provides a comprehensive overview of how traders can draw trendlines effectively to enhance their trading strategies.
Understanding the Purpose of Trendlines in Trading
Trendlines serve as visual representations that depict the general movement or momentum of an asset's price over time. They help traders recognize whether a market is trending upward (bullish), downward (bearish), or moving sideways (sideways consolidation). By connecting significant price points, trendlines reveal potential support and resistance levels—areas where prices tend to bounce or reverse.
In volatile markets like cryptocurrencies, trendlines are especially valuable because they simplify complex price data into clear visual cues. They enable traders to stay aligned with prevailing trends rather than reacting impulsively to short-term fluctuations.
Selecting Key Price Points for Drawing Trendlines
The effectiveness of a trendline hinges on choosing the right points on the chart. These points should reflect meaningful reversals or significant moves rather than minor fluctuations or noise.
- Identify Swing Highs and Swing Lows: Look for prominent peaks (swing highs) in an uptrend and troughs (swing lows) in a downtrend.
- Focus on Reversal Points: Select points where the price has reversed direction after touching certain levels—these often indicate strong support or resistance.
- Use Multiple Touchpoints: The more times the price touches or reacts near your drawn line without breaking it significantly, the stronger its validity becomes.
For example, in an uptrend, connect at least two swing lows that align horizontally; similarly, for downtrends, connect swing highs that form consistent peaks.
Connecting Price Points Accurately
Once you've identified key points:
- Draw Smooth Lines: Use your charting tool’s drawing feature to connect these points with straight lines that follow their general trajectory.
- Avoid Overfitting: Don’t force lines through every minor high or low; focus on major reversal points for clarity.
- Adjust as Needed: Markets evolve; be prepared to modify your trendline if new data suggests it no longer accurately reflects current trends.
A well-drawn line should not be jagged but smoothly follow through relevant touchpoints while capturing the overall direction without overcomplicating it.
Validating Trendline Significance
Not all drawn lines hold predictive power; validation is essential:
- Multiple Touchpoints Confirm Strength: A valid trendline typically has at least two touchpoints; three or more reinforce its significance.
- Observe Reactions at Support/Resistance Levels: When prices bounce off these lines consistently before reversing again—this indicates strong support/resistance.
- Look for Breakouts and Fakeouts: A break above/below a trendline signals potential change but requires confirmation through volume spikes or other indicators like RSI divergence to avoid false signals.
Regularly testing your drawn lines against real-time data ensures they remain relevant within changing market conditions.
Using Multiple Time Frames for Better Accuracy
Analyzing charts across different time frames enhances confidence in your trendline analysis:
- Short-term charts (e.g., 15-minute) help identify immediate trends but may be noisy.
- Longer-term charts (e.g., daily/weekly) provide broader context about overall market directions.
Drawing parallel trendlines across multiple time frames allows you to confirm whether short-term movements align with longer-term trends—a practice known as multi-time frame analysis—which increases reliability when making trades based on these lines.
Combining Trendlines With Other Technical Indicators
While powerful alone, combining trendline analysis with other tools improves decision-making accuracy:
- Moving averages can confirm trending directions indicated by slope angles.
- Relative Strength Index (RSI) helps identify overbought/oversold conditions near support/resistance levels suggested by trendlines.
- Bollinger Bands highlight volatility zones around established trends which can signal potential breakouts when combined with breakout from a trendline pattern.
This integrated approach reduces false signals caused by relying solely on one indicator type and aligns well with best practices recommended by experienced traders and analysts who prioritize robust risk management strategies rooted in proven technical methods.
Recent Advances Enhancing Trendline Drawing Techniques
Technological developments have transformed how traders draw and interpret trendlines:
Automation Through Machine Learning & AI
Modern algorithms now assist in automatically identifying key reversal points based on historical data patterns. These systems analyze vast datasets faster than manual methods could allow—and often suggest optimal placement for dynamic adjustment during live trading sessions—improving accuracy especially during volatile periods such as crypto booms like 2017’s surge or sudden crashes like those seen during COVID-related market shocks in 2020.
Social Media & Community Insights
Platforms such as Twitter and Reddit foster collaborative environments where traders share annotated charts highlighting effective ways they’ve drawn reliable trade-supporting lines under various conditions—including crypto markets characterized by rapid swings—thus democratizing access to refined techniques previously reserved for institutional analysts.
Integration With Charting Software
Most modern charting platforms incorporate features allowing users to automate some aspects of drawing multiple parallel channels simultaneously across different timeframes—aiding both novice investors seeking clarity amid chaos—and professional traders aiming for precision execution.
By mastering how to select appropriate key points, connect them accurately using smooth lines, validate their significance through multiple touchpoints—all while leveraging technological advancements—you can significantly improve your ability to draw effective trade-trend indicators. Combining this skill set with other analytical tools will empower you toward more confident decision-making within diverse markets—from stocks and forex currencies to high-volatility cryptocurrencies—and adapt swiftly amidst ever-changing financial landscapes.
Remember, consistent practice coupled with ongoing learning from both traditional techniques and innovative technologies will refine your ability over time—making you better equipped not just today but also prepared for future market shifts.
免责声明:含第三方内容,非财务建议。
详见《条款和条件》
How Are Exchange Transaction Fees Calculated?
Understanding how exchange transaction fees are calculated is essential for cryptocurrency traders and investors. These fees directly impact trading costs, profitability, and overall market participation. As the cryptocurrency ecosystem evolves rapidly, so do the methods and policies surrounding fee structures. This article provides a comprehensive overview of how these fees are determined, considering various influencing factors and recent industry trends.
What Are Cryptocurrency Exchange Transaction Fees?
Exchange transaction fees are charges imposed by cryptocurrency platforms when users buy, sell, trade, or withdraw digital assets. These fees serve multiple purposes: covering operational costs for exchanges, incentivizing certain trading behaviors (like high-volume trading), and generating revenue. They also influence user engagement; lower fees often attract more active traders while higher ones might deter frequent transactions.
These fees can be applied in different ways depending on the exchange's policies—either as flat rates or percentage-based charges—and may vary based on transaction type or user activity level.
Factors Influencing Fee Calculation
The calculation of transaction fees is complex because it depends on several interrelated factors:
Transaction Type: Different types of trades—spot trading (immediate buy/sell), margin trading (leveraged positions), futures contracts—often have distinct fee structures due to varying risk profiles.
Trade Volume: Many exchanges implement tiered fee models where higher-volume traders benefit from reduced rates. This encourages larger trades and increased liquidity.
Market Conditions: Liquidity levels, volatility, and demand can cause fluctuations in fee rates temporarily or influence dynamic pricing models.
Exchange Policies: Each platform has its own set of rules regarding fee calculation which can change over time based on strategic goals or regulatory requirements.
Regulatory Environment: Legal frameworks in different jurisdictions may impose restrictions or mandates that affect how exchanges structure their fees.
Common Methods Used to Calculate Fees
Exchanges employ various methods to determine applicable charges:
Flat Fee Model: A fixed amount charged per transaction regardless of size; simple but less flexible for high-volume traders.
Percentage-Based Fee: A specific percentage of the total transaction value; widely used due to scalability with trade size.
Tiered Fee Structure: Multiple levels where users pay different rates depending on their 30-day trading volume; incentivizes larger trades by offering discounts at higher tiers.
Dynamic Fee Adjustment: Real-time adjustments based on current market conditions such as liquidity levels or network congestion—common in decentralized finance (DeFi) platforms.
Recent Trends Shaping Fee Structures
The industry has seen notable shifts toward transparency and fairness:
Many exchanges now publish clear fee schedules upfront to build trust with users—a move driven by increasing regulatory scrutiny and consumer demand for clarity.
High-volume traders often receive discounts through tiered systems that reward loyalty and activity levels—a strategy that promotes market liquidity while maintaining revenue streams.
Regulatory bodies worldwide have pushed for standardized practices ensuring compliance with anti-money laundering (AML) laws and consumer protection standards—all influencing how exchanges design their fee models.
Additionally, blockchain technology itself introduces new layers of costs through network usage fees ("gas" in Ethereum-based transactions). These blockchain-specific charges are sometimes passed directly onto users as part of the overall cost structure.
Impact of Fees on User Behavior & Market Dynamics
Transaction costs significantly influence trader behavior:
Elevated fees may discourage frequent transactions especially among retail investors with smaller portfolios—they might opt for longer holding periods instead.
Conversely, competitive low-fee environments foster increased activity but could pressure exchanges' profitability if not balanced properly against operational expenses.
Inconsistent or overly high-fee regimes can lead to decreased market stability as participants adjust strategies to minimize costs—potentially resulting in reduced liquidity during volatile periods.
Furthermore, fierce competition among crypto exchanges compels continuous adjustments in fee policies aimed at attracting diverse user bases without sacrificing revenue targets—a delicate balancing act requiring strategic planning informed by market analytics.
Key Dates & Industry Developments Impacting Fees
Understanding recent developments helps contextualize current practices:
In 2020 amid COVID-19’s surge in online activity, many platforms experienced heightened trading volumes leading them to reevaluate their fee structures amidst increased operational demands.
By 2021, regulators intensified oversight across jurisdictions like the US SEC or European authorities pushing towards more transparent disclosures about fee calculations—to protect consumers from hidden charges
The rise of decentralized exchanges (DEXs) introduced innovative models such as liquidity pools where users earn rewards based on tokenomics rather than traditional flat/percentage-based commissions—influencing broader industry standards
Economic uncertainties like inflation spikes during 2022 prompted some platforms to adjust their pricing strategies dynamically reflecting broader macroeconomic trends affecting crypto markets globally
These milestones highlight an ongoing evolution driven by technological advances alongside regulatory pressures shaping fairer yet sustainable business models within crypto markets.
By understanding these core elements—the factors influencing calculations, prevalent methods employed by platforms—and recognizing recent trends shaping transparency and fairness—you gain a clearer picture of how exchange transaction fees function within this dynamic environment. Whether you're a seasoned trader seeking cost-efficient options or a newcomer navigating your first trades safely informed about potential costs involved will help you make smarter decisions aligned with your financial goals within the evolving landscape of cryptocurrency markets.
JCUSER-F1IIaxXA
2025-05-11 11:40
How are exchange transaction fees calculated?
How Are Exchange Transaction Fees Calculated?
Understanding how exchange transaction fees are calculated is essential for cryptocurrency traders and investors. These fees directly impact trading costs, profitability, and overall market participation. As the cryptocurrency ecosystem evolves rapidly, so do the methods and policies surrounding fee structures. This article provides a comprehensive overview of how these fees are determined, considering various influencing factors and recent industry trends.
What Are Cryptocurrency Exchange Transaction Fees?
Exchange transaction fees are charges imposed by cryptocurrency platforms when users buy, sell, trade, or withdraw digital assets. These fees serve multiple purposes: covering operational costs for exchanges, incentivizing certain trading behaviors (like high-volume trading), and generating revenue. They also influence user engagement; lower fees often attract more active traders while higher ones might deter frequent transactions.
These fees can be applied in different ways depending on the exchange's policies—either as flat rates or percentage-based charges—and may vary based on transaction type or user activity level.
Factors Influencing Fee Calculation
The calculation of transaction fees is complex because it depends on several interrelated factors:
Transaction Type: Different types of trades—spot trading (immediate buy/sell), margin trading (leveraged positions), futures contracts—often have distinct fee structures due to varying risk profiles.
Trade Volume: Many exchanges implement tiered fee models where higher-volume traders benefit from reduced rates. This encourages larger trades and increased liquidity.
Market Conditions: Liquidity levels, volatility, and demand can cause fluctuations in fee rates temporarily or influence dynamic pricing models.
Exchange Policies: Each platform has its own set of rules regarding fee calculation which can change over time based on strategic goals or regulatory requirements.
Regulatory Environment: Legal frameworks in different jurisdictions may impose restrictions or mandates that affect how exchanges structure their fees.
Common Methods Used to Calculate Fees
Exchanges employ various methods to determine applicable charges:
Flat Fee Model: A fixed amount charged per transaction regardless of size; simple but less flexible for high-volume traders.
Percentage-Based Fee: A specific percentage of the total transaction value; widely used due to scalability with trade size.
Tiered Fee Structure: Multiple levels where users pay different rates depending on their 30-day trading volume; incentivizes larger trades by offering discounts at higher tiers.
Dynamic Fee Adjustment: Real-time adjustments based on current market conditions such as liquidity levels or network congestion—common in decentralized finance (DeFi) platforms.
Recent Trends Shaping Fee Structures
The industry has seen notable shifts toward transparency and fairness:
Many exchanges now publish clear fee schedules upfront to build trust with users—a move driven by increasing regulatory scrutiny and consumer demand for clarity.
High-volume traders often receive discounts through tiered systems that reward loyalty and activity levels—a strategy that promotes market liquidity while maintaining revenue streams.
Regulatory bodies worldwide have pushed for standardized practices ensuring compliance with anti-money laundering (AML) laws and consumer protection standards—all influencing how exchanges design their fee models.
Additionally, blockchain technology itself introduces new layers of costs through network usage fees ("gas" in Ethereum-based transactions). These blockchain-specific charges are sometimes passed directly onto users as part of the overall cost structure.
Impact of Fees on User Behavior & Market Dynamics
Transaction costs significantly influence trader behavior:
Elevated fees may discourage frequent transactions especially among retail investors with smaller portfolios—they might opt for longer holding periods instead.
Conversely, competitive low-fee environments foster increased activity but could pressure exchanges' profitability if not balanced properly against operational expenses.
Inconsistent or overly high-fee regimes can lead to decreased market stability as participants adjust strategies to minimize costs—potentially resulting in reduced liquidity during volatile periods.
Furthermore, fierce competition among crypto exchanges compels continuous adjustments in fee policies aimed at attracting diverse user bases without sacrificing revenue targets—a delicate balancing act requiring strategic planning informed by market analytics.
Key Dates & Industry Developments Impacting Fees
Understanding recent developments helps contextualize current practices:
In 2020 amid COVID-19’s surge in online activity, many platforms experienced heightened trading volumes leading them to reevaluate their fee structures amidst increased operational demands.
By 2021, regulators intensified oversight across jurisdictions like the US SEC or European authorities pushing towards more transparent disclosures about fee calculations—to protect consumers from hidden charges
The rise of decentralized exchanges (DEXs) introduced innovative models such as liquidity pools where users earn rewards based on tokenomics rather than traditional flat/percentage-based commissions—influencing broader industry standards
Economic uncertainties like inflation spikes during 2022 prompted some platforms to adjust their pricing strategies dynamically reflecting broader macroeconomic trends affecting crypto markets globally
These milestones highlight an ongoing evolution driven by technological advances alongside regulatory pressures shaping fairer yet sustainable business models within crypto markets.
By understanding these core elements—the factors influencing calculations, prevalent methods employed by platforms—and recognizing recent trends shaping transparency and fairness—you gain a clearer picture of how exchange transaction fees function within this dynamic environment. Whether you're a seasoned trader seeking cost-efficient options or a newcomer navigating your first trades safely informed about potential costs involved will help you make smarter decisions aligned with your financial goals within the evolving landscape of cryptocurrency markets.
免责声明:含第三方内容,非财务建议。
详见《条款和条件》
Can TradingView Alerts Trigger Bots? A Complete Guide
TradingView has become a cornerstone platform for traders and investors worldwide, offering powerful tools for market analysis, idea sharing, and trade execution. One of its standout features is the ability to set custom alerts based on specific market conditions. But a common question among traders and developers alike is: Can TradingView alerts trigger bots? This article explores this topic in depth, providing clarity on how TradingView alerts work with automation tools, the technical possibilities, limitations, and best practices to consider.
Understanding TradingView Alerts
TradingView’s alert system allows users to create notifications based on various criteria such as price levels, technical indicator signals, or chart patterns. These alerts can be configured using Pine Script — TradingView’s proprietary scripting language — which offers extensive flexibility for customizing conditions.
Alerts can notify users via email or push notifications directly through the platform. They serve as an efficient way to stay informed about market movements without constantly monitoring charts manually. However, these alerts are primarily designed for human notification rather than direct automation.
Can TradingView Alerts Automate Trades?
While TradingView itself does not natively support automated trading—meaning it cannot directly execute trades without user intervention—it provides mechanisms that enable integration with external systems capable of automating trades.
How External Automation Works
External automation involves connecting TradingView's alert system with third-party tools or scripts that can interpret these notifications and execute trades automatically. This process typically requires:
- API Access: Although TradingView does not offer a public API specifically for trading execution (as of October 2023), it provides certain API endpoints that developers can use to access data.
- Webhook Integration: Users can configure alerts in TradingView to send webhook requests when triggered. Webhooks are HTTP POST requests sent to specified URLs containing alert data.
- Third-Party Services: Platforms like Zapier, IFTTT (If This Then That), or custom server scripts listen for webhook calls from TradingView and then interact with brokerage APIs (such as Binance API or Interactive Brokers API) to place orders automatically.
Practical Example
Suppose you set an alert in TradingView when Bitcoin reaches a certain price level. When this condition occurs:
- The alert triggers.
- It sends a webhook request containing relevant data.
- An external script receives this request.
- The script then communicates with your broker’s API to execute buy/sell orders instantly.
This setup effectively turns your manual alert into an automated trading bot—though it's important to note that the actual "bot" resides outside of Trading View itself.
Limitations & Risks of Using Alerts for Automation
Despite the potential integrations available today, there are notable limitations and risks associated with relying solely on Alert-to-Bot setups:
Platform Restrictions
Trading View's primary function remains analytical; it doesn't provide native order execution capabilities through its interface except via partner brokers integrated into their ecosystem (like TradeStation). Therefore, full automation depends heavily on third-party solutions which may introduce complexity or reliability issues.
Regulatory Concerns
Automated trading strategies must comply with local regulations governing financial markets—especially in highly regulated environments like equities or derivatives markets—and failure could lead to legal repercussions if rules are violated unintentionally.
Security Risks
Using webhooks and third-party services increases exposure points where security breaches could occur—particularly if sensitive account credentials are involved or if communication channels aren't properly secured via encryption protocols like HTTPS.
Market Impact & Slippage
Automated systems reacting instantly might cause rapid order placements leading to slippage—a difference between expected transaction prices versus actual executed prices—which could impact profitability negatively if not carefully managed.
Best Practices When Using Alerts To Trigger Bots
To maximize safety while leveraging the power of automated trading based on Tradeview alerts:
- Use Secure Connections: Always ensure webhooks use HTTPS encryption.
- Implement Fail-Safes: Set limits such as maximum order sizes or cooldown periods between trades.
- Test Extensively: Run simulations before deploying real funds; monitor performance closely during initial phases.
- Stay Compliant: Keep abreast of regulatory requirements related to algorithmic trading within your jurisdiction.
- Maintain Transparency & Documentation: Keep logs of all automated activities for audit purposes and troubleshooting purposes later on.
Future Outlook: Will Tradeview Fully Support Automated Trades?
As technology advances and demand grows among retail traders seeking more seamless automation solutions, there is speculation about whether future updates will include native trade execution capabilities within Tradeview itself—or at least tighter integrations with brokerage platforms designed explicitly for algorithmic trading workflows.
Currently though, most professional-grade automated strategies still rely heavily on external scripting combined with robust APIs provided by brokers rather than direct platform support from Tradeview alone.
In summary, while Trading View's built-in alert system does not directly trigger bots within its own environment—that is primarily achieved through external integrations involving webhooks and third-party services—it offers significant flexibility enabling traders/developers who wish automate their strategies effectively using available tools responsibly. As always when automating financial transactions online: prioritize security measures; stay compliant; test thoroughly before going live; keep up-to-date regarding platform policies—and remember that responsible usage benefits everyone involved in digital asset markets.
Keywords: tradingview alerts trigger bots | automate trades using tradingview | webhook integration crypto | Pine Script automation | algo-trading platforms | secure auto-trading setup
JCUSER-WVMdslBw
2025-05-26 22:21
Can TradingView alerts trigger bots?
Can TradingView Alerts Trigger Bots? A Complete Guide
TradingView has become a cornerstone platform for traders and investors worldwide, offering powerful tools for market analysis, idea sharing, and trade execution. One of its standout features is the ability to set custom alerts based on specific market conditions. But a common question among traders and developers alike is: Can TradingView alerts trigger bots? This article explores this topic in depth, providing clarity on how TradingView alerts work with automation tools, the technical possibilities, limitations, and best practices to consider.
Understanding TradingView Alerts
TradingView’s alert system allows users to create notifications based on various criteria such as price levels, technical indicator signals, or chart patterns. These alerts can be configured using Pine Script — TradingView’s proprietary scripting language — which offers extensive flexibility for customizing conditions.
Alerts can notify users via email or push notifications directly through the platform. They serve as an efficient way to stay informed about market movements without constantly monitoring charts manually. However, these alerts are primarily designed for human notification rather than direct automation.
Can TradingView Alerts Automate Trades?
While TradingView itself does not natively support automated trading—meaning it cannot directly execute trades without user intervention—it provides mechanisms that enable integration with external systems capable of automating trades.
How External Automation Works
External automation involves connecting TradingView's alert system with third-party tools or scripts that can interpret these notifications and execute trades automatically. This process typically requires:
- API Access: Although TradingView does not offer a public API specifically for trading execution (as of October 2023), it provides certain API endpoints that developers can use to access data.
- Webhook Integration: Users can configure alerts in TradingView to send webhook requests when triggered. Webhooks are HTTP POST requests sent to specified URLs containing alert data.
- Third-Party Services: Platforms like Zapier, IFTTT (If This Then That), or custom server scripts listen for webhook calls from TradingView and then interact with brokerage APIs (such as Binance API or Interactive Brokers API) to place orders automatically.
Practical Example
Suppose you set an alert in TradingView when Bitcoin reaches a certain price level. When this condition occurs:
- The alert triggers.
- It sends a webhook request containing relevant data.
- An external script receives this request.
- The script then communicates with your broker’s API to execute buy/sell orders instantly.
This setup effectively turns your manual alert into an automated trading bot—though it's important to note that the actual "bot" resides outside of Trading View itself.
Limitations & Risks of Using Alerts for Automation
Despite the potential integrations available today, there are notable limitations and risks associated with relying solely on Alert-to-Bot setups:
Platform Restrictions
Trading View's primary function remains analytical; it doesn't provide native order execution capabilities through its interface except via partner brokers integrated into their ecosystem (like TradeStation). Therefore, full automation depends heavily on third-party solutions which may introduce complexity or reliability issues.
Regulatory Concerns
Automated trading strategies must comply with local regulations governing financial markets—especially in highly regulated environments like equities or derivatives markets—and failure could lead to legal repercussions if rules are violated unintentionally.
Security Risks
Using webhooks and third-party services increases exposure points where security breaches could occur—particularly if sensitive account credentials are involved or if communication channels aren't properly secured via encryption protocols like HTTPS.
Market Impact & Slippage
Automated systems reacting instantly might cause rapid order placements leading to slippage—a difference between expected transaction prices versus actual executed prices—which could impact profitability negatively if not carefully managed.
Best Practices When Using Alerts To Trigger Bots
To maximize safety while leveraging the power of automated trading based on Tradeview alerts:
- Use Secure Connections: Always ensure webhooks use HTTPS encryption.
- Implement Fail-Safes: Set limits such as maximum order sizes or cooldown periods between trades.
- Test Extensively: Run simulations before deploying real funds; monitor performance closely during initial phases.
- Stay Compliant: Keep abreast of regulatory requirements related to algorithmic trading within your jurisdiction.
- Maintain Transparency & Documentation: Keep logs of all automated activities for audit purposes and troubleshooting purposes later on.
Future Outlook: Will Tradeview Fully Support Automated Trades?
As technology advances and demand grows among retail traders seeking more seamless automation solutions, there is speculation about whether future updates will include native trade execution capabilities within Tradeview itself—or at least tighter integrations with brokerage platforms designed explicitly for algorithmic trading workflows.
Currently though, most professional-grade automated strategies still rely heavily on external scripting combined with robust APIs provided by brokers rather than direct platform support from Tradeview alone.
In summary, while Trading View's built-in alert system does not directly trigger bots within its own environment—that is primarily achieved through external integrations involving webhooks and third-party services—it offers significant flexibility enabling traders/developers who wish automate their strategies effectively using available tools responsibly. As always when automating financial transactions online: prioritize security measures; stay compliant; test thoroughly before going live; keep up-to-date regarding platform policies—and remember that responsible usage benefits everyone involved in digital asset markets.
Keywords: tradingview alerts trigger bots | automate trades using tradingview | webhook integration crypto | Pine Script automation | algo-trading platforms | secure auto-trading setup
免责声明:含第三方内容,非财务建议。
详见《条款和条件》
Trading Sentiment: An In-Depth Guide for Investors and Traders
Understanding trading sentiment is essential for anyone involved in financial markets. It reflects the collective attitude of market participants—investors, traders, analysts—toward the current and future state of assets or markets. Recognizing and analyzing these sentiments can provide valuable insights into potential market movements, helping investors make more informed decisions.
What Is Trading Sentiment?
Trading sentiment refers to the overall mood or emotional tone prevailing among market participants regarding a specific asset or the broader financial environment. It encompasses beliefs, expectations, fears, and hopes that influence buying and selling behaviors. When sentiment is positive (bullish), investors tend to buy more assets expecting prices to rise; when negative (bearish), they may sell off holdings fearing declines.
This collective psychology often drives short-term price fluctuations that technical analysis tools aim to identify. While fundamental analysis focuses on economic data and company performance, sentiment analysis emphasizes understanding how emotions impact market dynamics.
How Is Trading Sentiment Measured?
Market analysts utilize various indicators and tools to gauge prevailing investor attitudes:
Technical Indicators: Moving averages, Relative Strength Index (RSI), Bollinger Bands, chart patterns—all help identify overbought or oversold conditions that reflect bullish or bearish sentiments.
Fundamental Data: Earnings reports, economic indicators like GDP growth rates or unemployment figures influence overall optimism or pessimism about markets.
Market News & Events: Regulatory changes, geopolitical developments, technological breakthroughs can shift investor perceptions rapidly.
Sentiment Analysis Tools:
- Social media monitoring platforms analyze chatter on platforms like Twitter or Reddit.
- News aggregation services track headlines impacting specific sectors.
- Financial modeling software assesses data trends for predictive insights.
By combining these methods—both quantitative metrics and qualitative assessments—traders develop a comprehensive picture of current market mood.
The Role of Market Psychology in Trading Sentiment
Psychological factors are central to understanding why sentiment influences trading behavior so profoundly. Emotions such as fear during downturns lead investors toward risk aversion; greed during booms encourages speculative buying. These emotional responses often cause prices to deviate from intrinsic values temporarily.
Market psychology also explains phenomena like herd behavior—where traders follow popular trends without thorough analysis—or panic selling during crises. Recognizing these psychological patterns helps traders anticipate potential reversals or continuations in price movements driven by shifts in collective emotion rather than fundamentals alone.
Recent Examples Demonstrating Market Sentiment Dynamics
Recent events highlight how quickly trading sentiment can change based on news:
BioPlus Acquisition Corp (BIOS) experienced a shift toward bearishness after concerns about delisting emerged on May 10th, 2025[1]. Such negative news can trigger widespread caution among investors leading to declining stock prices.
Despite ongoing expansion efforts at Aave USD (AAVEUSD), market sentiment remained bearish as of April 30th, 2025[2]. This disconnect suggests that external factors like macroeconomic conditions might overshadow positive developments within an ecosystem.
Conversely, C3.ai Inc.'s stock saw a dramatic surge with a 122% increase in call options traded on May 10th[3], indicating bullish enthusiasm possibly driven by expectations of future growth fueled by increased investor interest.
Insider trades at New Fortress Energy Inc., reported around May 11th[5], could signal confidence from insiders—a factor often interpreted as positive sentiment but also warranting cautious interpretation depending on context.
Wheels Up Experience Inc.'s fluctuating volumes amid uncertainty exemplify how mixed sentiments create volatile trading environments where unpredictability persists[4].
These examples underscore how news flow—from corporate actions to regulatory updates—influence trader perceptions swiftly across different sectors and asset classes.
Why Does Trading Sentiment Matter for Investors?
For both seasoned traders and long-term investors alike, understanding trading sentiment offers several advantages:
Timing Entry & Exit Points: Recognizing when optimism is overextended may signal upcoming corrections; similarly with excessive pessimism signaling potential rebounds.
Risk Management: Awareness of prevailing moods helps set appropriate stop-loss levels based on probable volatility caused by emotional reactions rather than fundamentals.
Contrarian Strategies: Some successful investors adopt contrarian approaches—they go against prevailing sentiments when they believe markets are overly optimistic or pessimistic relative to actual valuations.
Predictive Power: While not infallible alone — since emotions can be irrational — combining sentiment analysis with other methods enhances forecasting accuracy.
The Impact of Cryptocurrency Markets' Unique Dynamics
Cryptocurrency markets exemplify heightened sensitivity towards trader emotions due to their decentralized nature and high speculation levels [LSI Keyword]. Unlike traditional assets influenced heavily by macroeconomic data—which may have delayed effects—the crypto space reacts swiftly following news events such as regulatory announcements or technological upgrades [Semantic Keyword].
Social media hype often fuels rapid price swings; memes-driven narratives can induce euphoria followed by sharp corrections once hype subsides [Related Keyword]. As such,
Sentiment plays an even more critical role in crypto investing compared with traditional equities because it directly impacts liquidity flows within short timeframes.
How Can Traders Use Sentiment Analysis Effectively?
To leverage trading sentiment effectively:
- Combine multiple indicators—including technical signals with social media trends—to confirm signals before acting.
- Stay updated with real-time news feeds relevant to your holdings.
- Monitor insider trades if available—they sometimes serve as early signs of institutional confidence shifts.4.. Be cautious about herd mentality; always verify whether recent moves align with underlying fundamentals rather than just emotion-driven hype.
Best Practices Include:
- Using dedicated social listening tools
- Tracking sector-specific news
- Incorporating behavioral finance principles into decision-making
Risks Associated With Relying Solely On Market Mood
While understanding general mood provides valuable context,
it's crucial not to rely exclusively on sentimental cues for investment decisions because emotions can be irrational—and sometimes lead markets astray from fundamental values [E-A-T Principle].
Overconfidence during euphoric phases might inflate asset prices beyond sustainable levels; conversely,panic selling amid fear could overlook solid long-term opportunities [Trustworthiness Aspect].
Therefore,
integrating sentimental insights within a balanced framework—including fundamental analysis—is essential for sound investing strategies.
By grasping what trading sentiment entails—from its measurement techniques through psychological underpinnings—you gain an important edge in navigating complex financial landscapes effectively.[LSI Keywords]: investor psychology | market indicators | behavioral finance | technical vs fundamental analysis | crypto volatility
JCUSER-WVMdslBw
2025-05-11 13:38
What is trading sentiment?
Trading Sentiment: An In-Depth Guide for Investors and Traders
Understanding trading sentiment is essential for anyone involved in financial markets. It reflects the collective attitude of market participants—investors, traders, analysts—toward the current and future state of assets or markets. Recognizing and analyzing these sentiments can provide valuable insights into potential market movements, helping investors make more informed decisions.
What Is Trading Sentiment?
Trading sentiment refers to the overall mood or emotional tone prevailing among market participants regarding a specific asset or the broader financial environment. It encompasses beliefs, expectations, fears, and hopes that influence buying and selling behaviors. When sentiment is positive (bullish), investors tend to buy more assets expecting prices to rise; when negative (bearish), they may sell off holdings fearing declines.
This collective psychology often drives short-term price fluctuations that technical analysis tools aim to identify. While fundamental analysis focuses on economic data and company performance, sentiment analysis emphasizes understanding how emotions impact market dynamics.
How Is Trading Sentiment Measured?
Market analysts utilize various indicators and tools to gauge prevailing investor attitudes:
Technical Indicators: Moving averages, Relative Strength Index (RSI), Bollinger Bands, chart patterns—all help identify overbought or oversold conditions that reflect bullish or bearish sentiments.
Fundamental Data: Earnings reports, economic indicators like GDP growth rates or unemployment figures influence overall optimism or pessimism about markets.
Market News & Events: Regulatory changes, geopolitical developments, technological breakthroughs can shift investor perceptions rapidly.
Sentiment Analysis Tools:
- Social media monitoring platforms analyze chatter on platforms like Twitter or Reddit.
- News aggregation services track headlines impacting specific sectors.
- Financial modeling software assesses data trends for predictive insights.
By combining these methods—both quantitative metrics and qualitative assessments—traders develop a comprehensive picture of current market mood.
The Role of Market Psychology in Trading Sentiment
Psychological factors are central to understanding why sentiment influences trading behavior so profoundly. Emotions such as fear during downturns lead investors toward risk aversion; greed during booms encourages speculative buying. These emotional responses often cause prices to deviate from intrinsic values temporarily.
Market psychology also explains phenomena like herd behavior—where traders follow popular trends without thorough analysis—or panic selling during crises. Recognizing these psychological patterns helps traders anticipate potential reversals or continuations in price movements driven by shifts in collective emotion rather than fundamentals alone.
Recent Examples Demonstrating Market Sentiment Dynamics
Recent events highlight how quickly trading sentiment can change based on news:
BioPlus Acquisition Corp (BIOS) experienced a shift toward bearishness after concerns about delisting emerged on May 10th, 2025[1]. Such negative news can trigger widespread caution among investors leading to declining stock prices.
Despite ongoing expansion efforts at Aave USD (AAVEUSD), market sentiment remained bearish as of April 30th, 2025[2]. This disconnect suggests that external factors like macroeconomic conditions might overshadow positive developments within an ecosystem.
Conversely, C3.ai Inc.'s stock saw a dramatic surge with a 122% increase in call options traded on May 10th[3], indicating bullish enthusiasm possibly driven by expectations of future growth fueled by increased investor interest.
Insider trades at New Fortress Energy Inc., reported around May 11th[5], could signal confidence from insiders—a factor often interpreted as positive sentiment but also warranting cautious interpretation depending on context.
Wheels Up Experience Inc.'s fluctuating volumes amid uncertainty exemplify how mixed sentiments create volatile trading environments where unpredictability persists[4].
These examples underscore how news flow—from corporate actions to regulatory updates—influence trader perceptions swiftly across different sectors and asset classes.
Why Does Trading Sentiment Matter for Investors?
For both seasoned traders and long-term investors alike, understanding trading sentiment offers several advantages:
Timing Entry & Exit Points: Recognizing when optimism is overextended may signal upcoming corrections; similarly with excessive pessimism signaling potential rebounds.
Risk Management: Awareness of prevailing moods helps set appropriate stop-loss levels based on probable volatility caused by emotional reactions rather than fundamentals.
Contrarian Strategies: Some successful investors adopt contrarian approaches—they go against prevailing sentiments when they believe markets are overly optimistic or pessimistic relative to actual valuations.
Predictive Power: While not infallible alone — since emotions can be irrational — combining sentiment analysis with other methods enhances forecasting accuracy.
The Impact of Cryptocurrency Markets' Unique Dynamics
Cryptocurrency markets exemplify heightened sensitivity towards trader emotions due to their decentralized nature and high speculation levels [LSI Keyword]. Unlike traditional assets influenced heavily by macroeconomic data—which may have delayed effects—the crypto space reacts swiftly following news events such as regulatory announcements or technological upgrades [Semantic Keyword].
Social media hype often fuels rapid price swings; memes-driven narratives can induce euphoria followed by sharp corrections once hype subsides [Related Keyword]. As such,
Sentiment plays an even more critical role in crypto investing compared with traditional equities because it directly impacts liquidity flows within short timeframes.
How Can Traders Use Sentiment Analysis Effectively?
To leverage trading sentiment effectively:
- Combine multiple indicators—including technical signals with social media trends—to confirm signals before acting.
- Stay updated with real-time news feeds relevant to your holdings.
- Monitor insider trades if available—they sometimes serve as early signs of institutional confidence shifts.4.. Be cautious about herd mentality; always verify whether recent moves align with underlying fundamentals rather than just emotion-driven hype.
Best Practices Include:
- Using dedicated social listening tools
- Tracking sector-specific news
- Incorporating behavioral finance principles into decision-making
Risks Associated With Relying Solely On Market Mood
While understanding general mood provides valuable context,
it's crucial not to rely exclusively on sentimental cues for investment decisions because emotions can be irrational—and sometimes lead markets astray from fundamental values [E-A-T Principle].
Overconfidence during euphoric phases might inflate asset prices beyond sustainable levels; conversely,panic selling amid fear could overlook solid long-term opportunities [Trustworthiness Aspect].
Therefore,
integrating sentimental insights within a balanced framework—including fundamental analysis—is essential for sound investing strategies.
By grasping what trading sentiment entails—from its measurement techniques through psychological underpinnings—you gain an important edge in navigating complex financial landscapes effectively.[LSI Keywords]: investor psychology | market indicators | behavioral finance | technical vs fundamental analysis | crypto volatility
免责声明:含第三方内容,非财务建议。
详见《条款和条件》
Are Trailing Stops Available on TradingView?
Understanding whether trailing stops are accessible on TradingView is essential for traders and investors aiming to optimize their risk management strategies. Trailing stops are a popular tool among traders because they allow for dynamic adjustment of stop-loss levels, helping to lock in profits while minimizing potential losses. However, the platform's current features and recent updates influence how effectively users can implement this strategy.
What Are Trailing Stops and Why Do They Matter?
Trailing stops are a type of stop-loss order that automatically moves with the price of an asset as it trends favorably. Unlike fixed stop-loss orders, which remain static regardless of market movements, trailing stops adapt to price changes by adjusting the stop level proportionally or by a set dollar amount. This means if an asset’s price rises, the trailing stop moves upward accordingly, allowing traders to maximize gains without manually repositioning their stops.
For example, if you buy a stock at $100 with a 10% trailing stop, your stop will initially be set at $90. If the stock rises to $110, your trailing stop will move up to $99 (10% below $110). Should the stock then decline from its peak back down past this point, your position would automatically be sold—protecting profits while giving room for continued upward movement.
This flexibility makes trailing stops particularly valuable in volatile markets like cryptocurrencies or commodities where prices fluctuate frequently but tend to trend over time.
Does TradingView Support Traditional Trailing Stops?
TradingView does not natively support traditional trailing stops as some dedicated trading platforms do (such as MetaTrader or Thinkorswim). Instead, it offers a feature called "Dynamic Stop," which serves as an alternative method for implementing similar risk management techniques within its charting environment.
The Dynamic Stop feature allows users to set parameters—either percentage-based or dollar-based—that adjust their initial stop-loss level dynamically based on market movements. While not identical in functionality to classic trailing stops that automatically follow every tick change in price via order execution systems directly linked with broker accounts, this feature provides significant flexibility through manual adjustments or scripting.
How Can Traders Use Dynamic Stop on TradingView?
To utilize Dynamic Stop effectively on TradingView:
- Set Initial Parameters: Decide whether you want your dynamic adjustment based on percentage changes or fixed dollar amounts.
- Customize Adjustment Rules: Define how much the stop should move when certain conditions are met.
- Combine with Alerts: Use alerts and scripts (like Pine Script) to automate some aspects of dynamic adjustments.
Many experienced traders create custom scripts using Pine Script—a proprietary scripting language—to mimic traditional trailing stops more closely. These scripts can monitor real-time data and modify alert levels accordingly but require some programming knowledge.
Recent Updates and Developments
In recent years—particularly 2023 and early 2024—TradingView has focused heavily on enhancing its technical analysis tools rather than adding native order types like traditional trailing stops. The platform introduced several updates aimed at improving charting capabilities but did not explicitly incorporate native support for classic trail-stop orders within its core trading features.
However:
- The platform announced plans in 2024 aimed at expanding API capabilities that could facilitate third-party integrations.
- Many community-developed indicators and scripts have emerged that attempt to replicate trail-stop behavior more accurately.
- User feedback remains strong regarding the desire for native support of true trailing orders directly linked with brokerage accounts integrated into TradingView’s ecosystem.
Community Feedback & Workarounds
The absence of built-in traditional trailing stops has led many users toward creative workarounds:
- Developing custom Pine Scripts that simulate trail-stops based on real-time data.
- Using third-party indicators available through public libraries within TradingView’s community marketplace.
- Combining alerts with manual trade management strategies when automation isn’t fully possible within current platform constraints.
While these methods aren’t perfect substitutes for integrated order types found elsewhere, they demonstrate active user engagement seeking better solutions aligned with their trading needs.
Market Trends Influencing Future Features
The increasing popularity of cryptocurrencies has amplified demand for advanced risk management tools like true trailing stops due to high volatility environments where quick adjustments matter most. As crypto markets continue evolving rapidly—and given Trader sentiment leaning towards automation—it is plausible that future versions of TradingView might incorporate native support for such features either through direct updates or enhanced API integrations facilitating broker connectivity.
Furthermore:
- Regulatory developments* emphasizing transparency and risk controls could also motivate platforms like TradingView to expand their offerings beyond basic alert systems toward more comprehensive trade automation options including genuine trail-stops embedded into order execution workflows.
How Does This Impact Traders Using TradingView?
For active traders relying solely on built-in features:
- They may need supplementary tools such as custom scripts or external brokers supporting automated trail-stops.
- Manual adjustments remain necessary unless they leverage third-party integrations via APIs once available broadly.
- Overall satisfaction depends heavily on individual needs; those comfortable scripting may find effective workarounds whereas others might prefer platforms offering native support out-of-the-box.
Final Thoughts: Is It Worth Relying Solely On TradingView For Trailing Stops?
While TradingView excels as a powerful charting tool favored by technical analysts worldwide—including extensive indicator libraries—it currently lacks seamless integration of traditional automatic trailing-stop orders directly tied into brokerage executions within its core system. Its "Dynamic Stop" feature provides useful flexibility but requires manual intervention or scripting expertise for best results.
For traders prioritizing automated risk management, especially those who depend heavily on true trail-stops during fast-moving markets like crypto trading sessions — exploring other platforms offering native order types might be advisable until further enhancements arrive from Trading View itself.
Meanwhile, active users should stay updated through official releases and community forums where ongoing developments aim at bridging this gap between advanced trade automation needs and existing platform capabilities.
Keywords: Trailing Stops on Tradingview | Dynamic Stop Feature | Risk Management Tools | Automated Trade Strategies | Pine Script Customization | Crypto Volatility Strategies
JCUSER-IC8sJL1q
2025-05-26 21:56
Are trailing stops available on TradingView?
Are Trailing Stops Available on TradingView?
Understanding whether trailing stops are accessible on TradingView is essential for traders and investors aiming to optimize their risk management strategies. Trailing stops are a popular tool among traders because they allow for dynamic adjustment of stop-loss levels, helping to lock in profits while minimizing potential losses. However, the platform's current features and recent updates influence how effectively users can implement this strategy.
What Are Trailing Stops and Why Do They Matter?
Trailing stops are a type of stop-loss order that automatically moves with the price of an asset as it trends favorably. Unlike fixed stop-loss orders, which remain static regardless of market movements, trailing stops adapt to price changes by adjusting the stop level proportionally or by a set dollar amount. This means if an asset’s price rises, the trailing stop moves upward accordingly, allowing traders to maximize gains without manually repositioning their stops.
For example, if you buy a stock at $100 with a 10% trailing stop, your stop will initially be set at $90. If the stock rises to $110, your trailing stop will move up to $99 (10% below $110). Should the stock then decline from its peak back down past this point, your position would automatically be sold—protecting profits while giving room for continued upward movement.
This flexibility makes trailing stops particularly valuable in volatile markets like cryptocurrencies or commodities where prices fluctuate frequently but tend to trend over time.
Does TradingView Support Traditional Trailing Stops?
TradingView does not natively support traditional trailing stops as some dedicated trading platforms do (such as MetaTrader or Thinkorswim). Instead, it offers a feature called "Dynamic Stop," which serves as an alternative method for implementing similar risk management techniques within its charting environment.
The Dynamic Stop feature allows users to set parameters—either percentage-based or dollar-based—that adjust their initial stop-loss level dynamically based on market movements. While not identical in functionality to classic trailing stops that automatically follow every tick change in price via order execution systems directly linked with broker accounts, this feature provides significant flexibility through manual adjustments or scripting.
How Can Traders Use Dynamic Stop on TradingView?
To utilize Dynamic Stop effectively on TradingView:
- Set Initial Parameters: Decide whether you want your dynamic adjustment based on percentage changes or fixed dollar amounts.
- Customize Adjustment Rules: Define how much the stop should move when certain conditions are met.
- Combine with Alerts: Use alerts and scripts (like Pine Script) to automate some aspects of dynamic adjustments.
Many experienced traders create custom scripts using Pine Script—a proprietary scripting language—to mimic traditional trailing stops more closely. These scripts can monitor real-time data and modify alert levels accordingly but require some programming knowledge.
Recent Updates and Developments
In recent years—particularly 2023 and early 2024—TradingView has focused heavily on enhancing its technical analysis tools rather than adding native order types like traditional trailing stops. The platform introduced several updates aimed at improving charting capabilities but did not explicitly incorporate native support for classic trail-stop orders within its core trading features.
However:
- The platform announced plans in 2024 aimed at expanding API capabilities that could facilitate third-party integrations.
- Many community-developed indicators and scripts have emerged that attempt to replicate trail-stop behavior more accurately.
- User feedback remains strong regarding the desire for native support of true trailing orders directly linked with brokerage accounts integrated into TradingView’s ecosystem.
Community Feedback & Workarounds
The absence of built-in traditional trailing stops has led many users toward creative workarounds:
- Developing custom Pine Scripts that simulate trail-stops based on real-time data.
- Using third-party indicators available through public libraries within TradingView’s community marketplace.
- Combining alerts with manual trade management strategies when automation isn’t fully possible within current platform constraints.
While these methods aren’t perfect substitutes for integrated order types found elsewhere, they demonstrate active user engagement seeking better solutions aligned with their trading needs.
Market Trends Influencing Future Features
The increasing popularity of cryptocurrencies has amplified demand for advanced risk management tools like true trailing stops due to high volatility environments where quick adjustments matter most. As crypto markets continue evolving rapidly—and given Trader sentiment leaning towards automation—it is plausible that future versions of TradingView might incorporate native support for such features either through direct updates or enhanced API integrations facilitating broker connectivity.
Furthermore:
- Regulatory developments* emphasizing transparency and risk controls could also motivate platforms like TradingView to expand their offerings beyond basic alert systems toward more comprehensive trade automation options including genuine trail-stops embedded into order execution workflows.
How Does This Impact Traders Using TradingView?
For active traders relying solely on built-in features:
- They may need supplementary tools such as custom scripts or external brokers supporting automated trail-stops.
- Manual adjustments remain necessary unless they leverage third-party integrations via APIs once available broadly.
- Overall satisfaction depends heavily on individual needs; those comfortable scripting may find effective workarounds whereas others might prefer platforms offering native support out-of-the-box.
Final Thoughts: Is It Worth Relying Solely On TradingView For Trailing Stops?
While TradingView excels as a powerful charting tool favored by technical analysts worldwide—including extensive indicator libraries—it currently lacks seamless integration of traditional automatic trailing-stop orders directly tied into brokerage executions within its core system. Its "Dynamic Stop" feature provides useful flexibility but requires manual intervention or scripting expertise for best results.
For traders prioritizing automated risk management, especially those who depend heavily on true trail-stops during fast-moving markets like crypto trading sessions — exploring other platforms offering native order types might be advisable until further enhancements arrive from Trading View itself.
Meanwhile, active users should stay updated through official releases and community forums where ongoing developments aim at bridging this gap between advanced trade automation needs and existing platform capabilities.
Keywords: Trailing Stops on Tradingview | Dynamic Stop Feature | Risk Management Tools | Automated Trade Strategies | Pine Script Customization | Crypto Volatility Strategies
免责声明:含第三方内容,非财务建议。
详见《条款和条件》
What Is the Execution Speed of a Market Order?
Understanding the execution speed of a market order is essential for traders and investors aiming to optimize their trading strategies. In fast-moving markets like cryptocurrencies, stocks, or forex, milliseconds can make the difference between profit and loss. This article explores what determines how quickly a market order gets filled, why it matters, and recent trends influencing this critical aspect of trading.
How Does Market Order Execution Work?
A market order is one of the simplest types of trading orders. When you place a market order, you're instructing your broker to buy or sell a security immediately at the best available current price. Unlike limit orders that specify a maximum or minimum price point, market orders prioritize speed over price control.
Once submitted, these orders are routed through various systems—brokerage platforms, exchanges, and sometimes high-frequency trading (HFT) algorithms—to be matched with existing buy or sell offers in the marketplace. The time it takes from clicking "buy" or "sell" to seeing your trade executed is known as execution speed.
Factors Influencing How Quickly Market Orders Are Filled
Several elements influence how fast your market order gets executed:
Market Liquidity: Markets with high liquidity—meaning many buyers and sellers actively trading—allow for faster fills because matching orders are readily available.
Order Size: Larger trades may take longer to execute because they can impact current prices or require multiple smaller transactions across different liquidity pools.
Trading Infrastructure: Advanced technological infrastructure—including low-latency servers and optimized routing systems—enables quicker processing times for executing trades.
Market Conditions: During periods of high volatility or sudden news events (like earnings reports), execution speeds can fluctuate due to increased demand on exchange systems.
Understanding these factors helps traders anticipate potential delays during certain conditions and adjust their strategies accordingly.
Types of Execution Related to Market Orders
While standard market orders aim for immediate execution at prevailing prices, there are variations that influence how quickly they are filled:
Immediate or Cancel (IOC): Executes immediately; any unfilled portion is canceled.
Fill or Kill (FOK): Must be filled entirely at once; otherwise canceled.
Good Till Cancelled (GTC): Remains active until explicitly canceled but may not execute instantly if conditions aren’t met.
These variations affect not only whether an order executes quickly but also how much control traders have over fill prices during volatile periods.
Recent Trends Impacting Execution Speed
The landscape of trade execution has evolved rapidly over recent years due to technological innovations and regulatory shifts:
High-Frequency Trading (HFT)
HFT firms utilize algorithms capable executing thousands of trades within fractions of a second. Their focus on ultra-fast execution speeds has driven exchanges and brokers to invest heavily in infrastructure upgrades. While HFT enhances overall liquidity and reduces spreads—which benefits all traders—it also raises concerns about fairness and stability in markets due to potential flash crashes caused by rapid-fire trades gone awry.
Blockchain Technology & Cryptocurrency Markets
Blockchain advancements have significantly improved transaction transparency while reducing settlement times in crypto markets. Decentralized exchanges leveraging blockchain technology enable near-instantaneous trade executions without traditional intermediaries—a development that continues pushing down latency issues associated with digital asset trading.
Regulatory Environment
Regulators worldwide scrutinize HFT practices because extremely rapid executions can contribute to increased volatility. Some jurisdictions have introduced rules limiting certain high-speed activities which could slow down some aspects of trade processing but aim ultimately at maintaining fairer markets with stable prices.
Why Does Execution Speed Matter?
Fast execution speeds directly impact trader profitability especially in volatile environments where prices change rapidly within seconds. For retail investors using online platforms without sophisticated infrastructure, delays might mean missing out on favorable entry points—or worse—increasing slippage where actual transaction prices differ from expected ones due to lag time.
Moreover, institutional players employing algorithmic strategies depend heavily on minimal latency; even microseconds matter when executing large volumes across multiple assets simultaneously. As such, understanding what influences speed helps both individual traders optimize their setups—and regulators monitor systemic risks associated with ultra-fast trading practices.
Potential Risks Associated With Rapid Trade Executions
While faster executions generally benefit traders by providing more precise entry/exit points—and potentially better pricing—they also carry risks:
Market Instability: Rapid-fire trades can amplify volatility leading sometimes into flash crashes if algorithms react unpredictably during turbulent moments.
Increased Costs: Achieving higher speeds often involves investing in expensive technology infrastructure which might not be feasible for retail investors.
Regulatory Scrutiny: Growing concern about unfair advantages held by HFT firms could lead regulators worldwide to impose restrictions affecting overall execution times.
Final Thoughts: Navigating Modern Trading Speeds
The evolution toward faster market order executions reflects ongoing technological progress aimed at enhancing efficiency—but it’s accompanied by new challenges related to stability and fairness. Traders should stay informed about factors influencing speed such as platform capabilities, current market conditions, regulatory changes—and consider these when designing their strategies.
By understanding what impacts how quickly your orders get filled—from liquidity levels through technological infrastructure—you’re better equipped for making timely decisions that align with your investment goals while managing inherent risks associated with rapid-market dynamics.
This overview aims to provide clarity around what determines the execution speed of a market order today. Whether you're an individual investor seeking quick entries/exits or an institutional trader relying on cutting-edge technology—knowing these fundamentals helps you navigate increasingly complex financial markets effectively while adhering to best practices rooted in transparency and risk management.
JCUSER-WVMdslBw
2025-05-29 02:22
What is the execution speed of a market order?
What Is the Execution Speed of a Market Order?
Understanding the execution speed of a market order is essential for traders and investors aiming to optimize their trading strategies. In fast-moving markets like cryptocurrencies, stocks, or forex, milliseconds can make the difference between profit and loss. This article explores what determines how quickly a market order gets filled, why it matters, and recent trends influencing this critical aspect of trading.
How Does Market Order Execution Work?
A market order is one of the simplest types of trading orders. When you place a market order, you're instructing your broker to buy or sell a security immediately at the best available current price. Unlike limit orders that specify a maximum or minimum price point, market orders prioritize speed over price control.
Once submitted, these orders are routed through various systems—brokerage platforms, exchanges, and sometimes high-frequency trading (HFT) algorithms—to be matched with existing buy or sell offers in the marketplace. The time it takes from clicking "buy" or "sell" to seeing your trade executed is known as execution speed.
Factors Influencing How Quickly Market Orders Are Filled
Several elements influence how fast your market order gets executed:
Market Liquidity: Markets with high liquidity—meaning many buyers and sellers actively trading—allow for faster fills because matching orders are readily available.
Order Size: Larger trades may take longer to execute because they can impact current prices or require multiple smaller transactions across different liquidity pools.
Trading Infrastructure: Advanced technological infrastructure—including low-latency servers and optimized routing systems—enables quicker processing times for executing trades.
Market Conditions: During periods of high volatility or sudden news events (like earnings reports), execution speeds can fluctuate due to increased demand on exchange systems.
Understanding these factors helps traders anticipate potential delays during certain conditions and adjust their strategies accordingly.
Types of Execution Related to Market Orders
While standard market orders aim for immediate execution at prevailing prices, there are variations that influence how quickly they are filled:
Immediate or Cancel (IOC): Executes immediately; any unfilled portion is canceled.
Fill or Kill (FOK): Must be filled entirely at once; otherwise canceled.
Good Till Cancelled (GTC): Remains active until explicitly canceled but may not execute instantly if conditions aren’t met.
These variations affect not only whether an order executes quickly but also how much control traders have over fill prices during volatile periods.
Recent Trends Impacting Execution Speed
The landscape of trade execution has evolved rapidly over recent years due to technological innovations and regulatory shifts:
High-Frequency Trading (HFT)
HFT firms utilize algorithms capable executing thousands of trades within fractions of a second. Their focus on ultra-fast execution speeds has driven exchanges and brokers to invest heavily in infrastructure upgrades. While HFT enhances overall liquidity and reduces spreads—which benefits all traders—it also raises concerns about fairness and stability in markets due to potential flash crashes caused by rapid-fire trades gone awry.
Blockchain Technology & Cryptocurrency Markets
Blockchain advancements have significantly improved transaction transparency while reducing settlement times in crypto markets. Decentralized exchanges leveraging blockchain technology enable near-instantaneous trade executions without traditional intermediaries—a development that continues pushing down latency issues associated with digital asset trading.
Regulatory Environment
Regulators worldwide scrutinize HFT practices because extremely rapid executions can contribute to increased volatility. Some jurisdictions have introduced rules limiting certain high-speed activities which could slow down some aspects of trade processing but aim ultimately at maintaining fairer markets with stable prices.
Why Does Execution Speed Matter?
Fast execution speeds directly impact trader profitability especially in volatile environments where prices change rapidly within seconds. For retail investors using online platforms without sophisticated infrastructure, delays might mean missing out on favorable entry points—or worse—increasing slippage where actual transaction prices differ from expected ones due to lag time.
Moreover, institutional players employing algorithmic strategies depend heavily on minimal latency; even microseconds matter when executing large volumes across multiple assets simultaneously. As such, understanding what influences speed helps both individual traders optimize their setups—and regulators monitor systemic risks associated with ultra-fast trading practices.
Potential Risks Associated With Rapid Trade Executions
While faster executions generally benefit traders by providing more precise entry/exit points—and potentially better pricing—they also carry risks:
Market Instability: Rapid-fire trades can amplify volatility leading sometimes into flash crashes if algorithms react unpredictably during turbulent moments.
Increased Costs: Achieving higher speeds often involves investing in expensive technology infrastructure which might not be feasible for retail investors.
Regulatory Scrutiny: Growing concern about unfair advantages held by HFT firms could lead regulators worldwide to impose restrictions affecting overall execution times.
Final Thoughts: Navigating Modern Trading Speeds
The evolution toward faster market order executions reflects ongoing technological progress aimed at enhancing efficiency—but it’s accompanied by new challenges related to stability and fairness. Traders should stay informed about factors influencing speed such as platform capabilities, current market conditions, regulatory changes—and consider these when designing their strategies.
By understanding what impacts how quickly your orders get filled—from liquidity levels through technological infrastructure—you’re better equipped for making timely decisions that align with your investment goals while managing inherent risks associated with rapid-market dynamics.
This overview aims to provide clarity around what determines the execution speed of a market order today. Whether you're an individual investor seeking quick entries/exits or an institutional trader relying on cutting-edge technology—knowing these fundamentals helps you navigate increasingly complex financial markets effectively while adhering to best practices rooted in transparency and risk management.
免责声明:含第三方内容,非财务建议。
详见《条款和条件》
What Is the Ask Price in Financial Markets?
The ask price, often referred to as the offer price, is a fundamental concept in finance that indicates the minimum price a seller is willing to accept for a security such as stocks, bonds, or cryptocurrencies. When investors want to buy a security, they typically look at the ask price because it represents the current selling point set by market participants. Understanding how ask prices function helps traders and investors make informed decisions about when and at what price to buy or sell assets.
In essence, the ask price forms part of what’s known as the bid-ask spread—the difference between what buyers are willing to pay (bid) and what sellers are asking for (ask). This spread is an important indicator of market liquidity and trading costs. A narrower spread generally suggests high liquidity and ease of trading, while wider spreads can indicate lower liquidity or higher transaction costs.
How Does the Ask Price Influence Market Trading?
The ask price plays a crucial role in determining real-time market value. It reflects current supply levels from sellers who are ready to transact immediately at that specified rate. For traders aiming for quick execution, matching their bid with an existing ask ensures faster trades but may involve paying slightly more than they would if waiting for prices to adjust.
Market dynamics—such as supply and demand—directly influence ask prices. When demand increases for a particular security, sellers tend to raise their asking prices due to heightened competition among buyers. Conversely, during periods of low demand or increased selling pressure, ask prices may decline as sellers attempt to attract buyers by lowering their offers.
Investors use knowledge of both bid and ask prices not only for executing trades but also for assessing market sentiment. For example:
- A rising ask price might signal strong seller confidence.
- A narrowing bid-ask spread could suggest increasing liquidity.
Understanding these signals helps investors gauge whether an asset is trending upward or downward.
Factors Affecting Ask Prices
Several factors influence how much sellers set as their asking price:
Supply and Demand Dynamics
Fundamentally driven by supply-demand mechanics; when more traders want an asset than there are available units (high demand), asks tend to rise. Conversely, if many holders wish to sell (high supply), asks may fall unless buyer interest remains strong.
Market Liquidity
Highly liquid markets—like major stock exchanges—generally feature tight spreads with narrow differences between bid and ask prices because numerous participants facilitate rapid transactions. Illiquid markets often have wider spreads due to fewer active traders.
Market Volatility
Volatility impacts how aggressively sellers set their asks; during turbulent times like financial crises or crypto crashes (e.g., 2022 downturns), asks can plummet rapidly amid panic selling or spike during bullish rallies such as Bitcoin's 2021 surge.
Regulatory Environment
Changes in regulations can influence investor confidence and thus affect asking behavior. Stricter rules on cryptocurrencies in some jurisdictions have led many traders toward cautious pricing strategies resulting in lower asks due to reduced participation.
Technological Innovations
Advancements like decentralized finance platforms introduce new mechanisms such as automated market makers (AMMs) which dynamically adjust asking prices based on algorithms rather than traditional order books — leading potentially faster adjustments aligned with real-time data.
Recent Trends Impacting Ask Prices
Recent years have seen notable shifts affecting how ask prices behave across different markets:
Cryptocurrency Volatility: During 2021’s crypto boom, high demand pushed up Bitcoin’s and Ethereum’s asking prices significantly; however, subsequent crashes like those experienced in 2022 caused sharp declines.
Regulatory Changes: Countries tightening cryptocurrency regulations impacted investor sentiment globally — leading some exchanges’ asked-for rates decreasing due partly to reduced trading activity.
Technological Developments: The rise of DeFi platforms has enabled real-time setting of dynamic asks through smart contracts — making markets more efficient but also introducing new risks like system failures or cyber threats.
Market Sentiment Trends: Phenomena such as meme stocks or NFTs created unique demand patterns that temporarily inflated certain securities’ asked-for rates beyond traditional valuation metrics.
Risks Associated With Fluctuating Ask Prices
While understanding where an asset's current asking level stands provides valuable insight into its valuation trendings—and potential entry points—it also comes with inherent risks:
• Market Volatility: Rapid swings between high and low ASK levels can make it difficult for investors seeking favorable trade executions without incurring significant costs.
• Liquidity Shortages: In less liquid segments—for instance small-cap stocks—the wide gap between bids and asks increases transaction costs substantially.
3 • Regulatory Uncertainty: Sudden policy changes can cause abrupt shifts in ASK levels; uncertainty discourages trading activity altogether.
4 • Technological Risks: As markets become increasingly reliant on digital infrastructure—including blockchain-based systems—they face cybersecurity threats that could disrupt normal pricing mechanisms.
How Investors Can Use Ask Price Data Effectively
For both retail traders entering individual positions—and institutional players managing large portfolios—monitoring ASK data offers strategic advantages:
- Recognize entry points when ASK drops below recent averages
- Identify potential breakout zones if ASK begins rising sharply
- Assess overall market health via tightness of spreads
- Detect signs of panic selling through sudden ASK declines
Using tools like Level II quotes—which display multiple layers beyond best bids/asks—can provide deeper insights into underlying order book depth helping refine timing decisions.
The Future Outlook on Ask Prices
As financial markets evolve—with ongoing technological innovations like AI-driven trading algorithms—the nature of setting questions around ASK will continue transforming rapidly:
Decentralized Finance platforms now allow users worldwide instant access without intermediaries; this democratizes access but introduces complexities around transparency & regulation impacting ASK behaviors globally.*
Regulatory landscapes remain uncertain especially within cryptocurrency sectors where governments seek balance between innovation & consumer protection—a factor likely influencing future fluctuations in ASK levels.*
Moreover market volatility, driven by macroeconomic factors including inflation trends & geopolitical tensions—as well as unforeseen events—will keep pushing ASK dynamics into unpredictable territory requiring vigilant monitoring from all types of investors.
By grasping what constitutes the ask price along with its influencing factors—from basic definitions through recent trends—you equip yourself better for navigating modern financial landscapes effectively. Whether you're investing directly into stocks or exploring emerging digital assets like cryptocurrencies & NFTs understanding these core concepts enhances your ability not just reactively but proactively manage your investment strategies amidst changing conditions.
JCUSER-F1IIaxXA
2025-05-20 00:05
What’s ask price?
What Is the Ask Price in Financial Markets?
The ask price, often referred to as the offer price, is a fundamental concept in finance that indicates the minimum price a seller is willing to accept for a security such as stocks, bonds, or cryptocurrencies. When investors want to buy a security, they typically look at the ask price because it represents the current selling point set by market participants. Understanding how ask prices function helps traders and investors make informed decisions about when and at what price to buy or sell assets.
In essence, the ask price forms part of what’s known as the bid-ask spread—the difference between what buyers are willing to pay (bid) and what sellers are asking for (ask). This spread is an important indicator of market liquidity and trading costs. A narrower spread generally suggests high liquidity and ease of trading, while wider spreads can indicate lower liquidity or higher transaction costs.
How Does the Ask Price Influence Market Trading?
The ask price plays a crucial role in determining real-time market value. It reflects current supply levels from sellers who are ready to transact immediately at that specified rate. For traders aiming for quick execution, matching their bid with an existing ask ensures faster trades but may involve paying slightly more than they would if waiting for prices to adjust.
Market dynamics—such as supply and demand—directly influence ask prices. When demand increases for a particular security, sellers tend to raise their asking prices due to heightened competition among buyers. Conversely, during periods of low demand or increased selling pressure, ask prices may decline as sellers attempt to attract buyers by lowering their offers.
Investors use knowledge of both bid and ask prices not only for executing trades but also for assessing market sentiment. For example:
- A rising ask price might signal strong seller confidence.
- A narrowing bid-ask spread could suggest increasing liquidity.
Understanding these signals helps investors gauge whether an asset is trending upward or downward.
Factors Affecting Ask Prices
Several factors influence how much sellers set as their asking price:
Supply and Demand Dynamics
Fundamentally driven by supply-demand mechanics; when more traders want an asset than there are available units (high demand), asks tend to rise. Conversely, if many holders wish to sell (high supply), asks may fall unless buyer interest remains strong.
Market Liquidity
Highly liquid markets—like major stock exchanges—generally feature tight spreads with narrow differences between bid and ask prices because numerous participants facilitate rapid transactions. Illiquid markets often have wider spreads due to fewer active traders.
Market Volatility
Volatility impacts how aggressively sellers set their asks; during turbulent times like financial crises or crypto crashes (e.g., 2022 downturns), asks can plummet rapidly amid panic selling or spike during bullish rallies such as Bitcoin's 2021 surge.
Regulatory Environment
Changes in regulations can influence investor confidence and thus affect asking behavior. Stricter rules on cryptocurrencies in some jurisdictions have led many traders toward cautious pricing strategies resulting in lower asks due to reduced participation.
Technological Innovations
Advancements like decentralized finance platforms introduce new mechanisms such as automated market makers (AMMs) which dynamically adjust asking prices based on algorithms rather than traditional order books — leading potentially faster adjustments aligned with real-time data.
Recent Trends Impacting Ask Prices
Recent years have seen notable shifts affecting how ask prices behave across different markets:
Cryptocurrency Volatility: During 2021’s crypto boom, high demand pushed up Bitcoin’s and Ethereum’s asking prices significantly; however, subsequent crashes like those experienced in 2022 caused sharp declines.
Regulatory Changes: Countries tightening cryptocurrency regulations impacted investor sentiment globally — leading some exchanges’ asked-for rates decreasing due partly to reduced trading activity.
Technological Developments: The rise of DeFi platforms has enabled real-time setting of dynamic asks through smart contracts — making markets more efficient but also introducing new risks like system failures or cyber threats.
Market Sentiment Trends: Phenomena such as meme stocks or NFTs created unique demand patterns that temporarily inflated certain securities’ asked-for rates beyond traditional valuation metrics.
Risks Associated With Fluctuating Ask Prices
While understanding where an asset's current asking level stands provides valuable insight into its valuation trendings—and potential entry points—it also comes with inherent risks:
• Market Volatility: Rapid swings between high and low ASK levels can make it difficult for investors seeking favorable trade executions without incurring significant costs.
• Liquidity Shortages: In less liquid segments—for instance small-cap stocks—the wide gap between bids and asks increases transaction costs substantially.
3 • Regulatory Uncertainty: Sudden policy changes can cause abrupt shifts in ASK levels; uncertainty discourages trading activity altogether.
4 • Technological Risks: As markets become increasingly reliant on digital infrastructure—including blockchain-based systems—they face cybersecurity threats that could disrupt normal pricing mechanisms.
How Investors Can Use Ask Price Data Effectively
For both retail traders entering individual positions—and institutional players managing large portfolios—monitoring ASK data offers strategic advantages:
- Recognize entry points when ASK drops below recent averages
- Identify potential breakout zones if ASK begins rising sharply
- Assess overall market health via tightness of spreads
- Detect signs of panic selling through sudden ASK declines
Using tools like Level II quotes—which display multiple layers beyond best bids/asks—can provide deeper insights into underlying order book depth helping refine timing decisions.
The Future Outlook on Ask Prices
As financial markets evolve—with ongoing technological innovations like AI-driven trading algorithms—the nature of setting questions around ASK will continue transforming rapidly:
Decentralized Finance platforms now allow users worldwide instant access without intermediaries; this democratizes access but introduces complexities around transparency & regulation impacting ASK behaviors globally.*
Regulatory landscapes remain uncertain especially within cryptocurrency sectors where governments seek balance between innovation & consumer protection—a factor likely influencing future fluctuations in ASK levels.*
Moreover market volatility, driven by macroeconomic factors including inflation trends & geopolitical tensions—as well as unforeseen events—will keep pushing ASK dynamics into unpredictable territory requiring vigilant monitoring from all types of investors.
By grasping what constitutes the ask price along with its influencing factors—from basic definitions through recent trends—you equip yourself better for navigating modern financial landscapes effectively. Whether you're investing directly into stocks or exploring emerging digital assets like cryptocurrencies & NFTs understanding these core concepts enhances your ability not just reactively but proactively manage your investment strategies amidst changing conditions.
免责声明:含第三方内容,非财务建议。
详见《条款和条件》
What Is Slippage in Crypto Trading?
Slippage is a common term in financial markets, especially within the cryptocurrency space. It refers to the difference between the expected price of a trade and the actual price at which it gets executed. For traders, understanding slippage is essential because it directly impacts profitability and risk management strategies. In volatile markets like crypto, where prices can fluctuate rapidly, slippage becomes an even more critical factor to consider.
When placing an order—whether it's a buy or sell—the trader anticipates execution at a specific price point. However, due to market dynamics such as sudden news events or liquidity constraints, the trade may execute at a different price than expected. This discrepancy can either work in favor of or against the trader but often results in unexpected costs if not properly managed.
Why Does Slippage Occur in Cryptocurrency Markets?
Crypto markets are inherently volatile and less liquid compared to traditional financial markets like stocks or forex. Several factors contribute to increased slippage:
- Market Volatility: Cryptocurrencies are known for their rapid price swings driven by news developments, regulatory announcements, or shifts in investor sentiment.
- Liquidity Levels: Many cryptocurrencies have lower trading volumes than traditional assets; this means fewer buy and sell orders at any given time.
- Order Execution Speed: The speed with which trades are processed influences whether they fill at desired prices. In fast-moving markets, delays can cause orders to execute at less favorable prices.
These factors combine to make slippage more prevalent and sometimes unpredictable within crypto trading environments.
Types of Slippage Commonly Encountered
Understanding different types of slippage helps traders develop better strategies for managing potential losses:
Bid-Ask Spread: The difference between what buyers are willing to pay (bid) and what sellers want (ask). A wider spread increases the chance that market orders will experience significant slippage.
Market Orders vs Limit Orders:
- Market Orders: Executed immediately at current market prices; highly susceptible to slippage because they do not specify an exact execution price.
- Limit Orders: Set at specific prices; these help control entry points but may not fill immediately if the market does not reach your specified level.
By choosing appropriate order types based on market conditions, traders can reduce exposure to adverse slippages.
How Traders Can Manage Slippage Effectively
Effective risk management involves using tools designed specifically for controlling potential losses from slippage:
Stop-Loss Orders: Automatically close positions when prices fall below certain levels—helping limit downside risks caused by unfavorable execution prices.
Take-Profit Orders: Lock in gains once assets reach targeted profit levels—reducing exposure during volatile periods where rapid reversals might occur.
Monitoring Order Books & Market Depth: By analyzing real-time order books on exchanges or decentralized platforms (DEXs), traders gain insights into liquidity levels and can strategically place orders where they’re less likely affected by large spreads or low liquidity zones.
Additionally, choosing trading times during higher liquidity periods—such as major crypto exchange hours—can significantly reduce chances of experiencing high-slippages.
Recent Trends Impacting Slippage in Crypto Trading
The landscape of cryptocurrency trading continues evolving due to technological innovations and regulatory developments:
Increased Market Activity: As mainstream adoption grows—with institutional investors entering—the volume has surged but so has volatility. Paradoxically, some segments face decreased liquidity despite higher activity levels because new participants often prefer smaller exchanges with limited depth.
Regulatory Changes: Governments worldwide are implementing rules affecting how cryptocurrencies are traded—from tax policies to licensing requirements—which influence overall market stability and volatility patterns that impact slippages.
Advancements in Trading Technology:
- High-frequency trading algorithms aim for faster executions with minimal slip
- Decentralized exchanges (DEXs) offer transparent order books that allow better visibility into available liquidity
- Smart contract-based automation reduces human error but still faces challenges related to network congestion
Educational initiatives also play a vital role here; many platforms now offer tutorials on managing risks associated with high-slippages through webinars and online courses tailored for both beginners and experienced traders alike.
Risks Associated With Unmanaged Slippage
Failing to account for potential slippages can lead directly—and sometimes unexpectedly—to financial losses:
- Traders relying solely on anticipated entry/exit points might find themselves executing trades far from their intended prices
- Repeated unanticipated slips erode confidence among retail investors who may withdraw from active participation
Moreover, persistent issues with excessive slipping could tarnish platform reputations if users perceive poor trade execution quality as unfair or unreliable—a concern regulators increasingly scrutinize under fair-trading standards frameworks globally.
How To Minimize Slippage Risks When Trading Crypto
To mitigate adverse effects from slippages effectively:
- Use limit orders instead of market orders whenever possible—they specify exact entry/exit points rather than accepting current best offers
- Trade during high-liquidity periods when bid-offer spreads tend narrower
- Monitor real-time order book data before placing large trades
- Employ advanced tools such as algorithmic trading bots designed explicitly for optimal timing
- Stay informed about upcoming news events that could trigger sudden volatility spikes
Implementing these practices enhances control over trade outcomes while reducing unexpected costs associated with unfavorable executions.
Understanding what causes slipage, recognizing its various forms across different order types—and actively employing risk mitigation techniques—is crucial for anyone involved in crypto trading today’s dynamic environment requires vigilance against unpredictable movements that could impact profitability significantly.
Staying informed about recent technological advancements like decentralized exchanges’ transparency features further empowers traders seeking efficient ways around common pitfalls like high-slippages while maintaining compliance amid evolving regulations ensures sustainable success over time.
JCUSER-F1IIaxXA
2025-05-11 11:45
What is slippage?
What Is Slippage in Crypto Trading?
Slippage is a common term in financial markets, especially within the cryptocurrency space. It refers to the difference between the expected price of a trade and the actual price at which it gets executed. For traders, understanding slippage is essential because it directly impacts profitability and risk management strategies. In volatile markets like crypto, where prices can fluctuate rapidly, slippage becomes an even more critical factor to consider.
When placing an order—whether it's a buy or sell—the trader anticipates execution at a specific price point. However, due to market dynamics such as sudden news events or liquidity constraints, the trade may execute at a different price than expected. This discrepancy can either work in favor of or against the trader but often results in unexpected costs if not properly managed.
Why Does Slippage Occur in Cryptocurrency Markets?
Crypto markets are inherently volatile and less liquid compared to traditional financial markets like stocks or forex. Several factors contribute to increased slippage:
- Market Volatility: Cryptocurrencies are known for their rapid price swings driven by news developments, regulatory announcements, or shifts in investor sentiment.
- Liquidity Levels: Many cryptocurrencies have lower trading volumes than traditional assets; this means fewer buy and sell orders at any given time.
- Order Execution Speed: The speed with which trades are processed influences whether they fill at desired prices. In fast-moving markets, delays can cause orders to execute at less favorable prices.
These factors combine to make slippage more prevalent and sometimes unpredictable within crypto trading environments.
Types of Slippage Commonly Encountered
Understanding different types of slippage helps traders develop better strategies for managing potential losses:
Bid-Ask Spread: The difference between what buyers are willing to pay (bid) and what sellers want (ask). A wider spread increases the chance that market orders will experience significant slippage.
Market Orders vs Limit Orders:
- Market Orders: Executed immediately at current market prices; highly susceptible to slippage because they do not specify an exact execution price.
- Limit Orders: Set at specific prices; these help control entry points but may not fill immediately if the market does not reach your specified level.
By choosing appropriate order types based on market conditions, traders can reduce exposure to adverse slippages.
How Traders Can Manage Slippage Effectively
Effective risk management involves using tools designed specifically for controlling potential losses from slippage:
Stop-Loss Orders: Automatically close positions when prices fall below certain levels—helping limit downside risks caused by unfavorable execution prices.
Take-Profit Orders: Lock in gains once assets reach targeted profit levels—reducing exposure during volatile periods where rapid reversals might occur.
Monitoring Order Books & Market Depth: By analyzing real-time order books on exchanges or decentralized platforms (DEXs), traders gain insights into liquidity levels and can strategically place orders where they’re less likely affected by large spreads or low liquidity zones.
Additionally, choosing trading times during higher liquidity periods—such as major crypto exchange hours—can significantly reduce chances of experiencing high-slippages.
Recent Trends Impacting Slippage in Crypto Trading
The landscape of cryptocurrency trading continues evolving due to technological innovations and regulatory developments:
Increased Market Activity: As mainstream adoption grows—with institutional investors entering—the volume has surged but so has volatility. Paradoxically, some segments face decreased liquidity despite higher activity levels because new participants often prefer smaller exchanges with limited depth.
Regulatory Changes: Governments worldwide are implementing rules affecting how cryptocurrencies are traded—from tax policies to licensing requirements—which influence overall market stability and volatility patterns that impact slippages.
Advancements in Trading Technology:
- High-frequency trading algorithms aim for faster executions with minimal slip
- Decentralized exchanges (DEXs) offer transparent order books that allow better visibility into available liquidity
- Smart contract-based automation reduces human error but still faces challenges related to network congestion
Educational initiatives also play a vital role here; many platforms now offer tutorials on managing risks associated with high-slippages through webinars and online courses tailored for both beginners and experienced traders alike.
Risks Associated With Unmanaged Slippage
Failing to account for potential slippages can lead directly—and sometimes unexpectedly—to financial losses:
- Traders relying solely on anticipated entry/exit points might find themselves executing trades far from their intended prices
- Repeated unanticipated slips erode confidence among retail investors who may withdraw from active participation
Moreover, persistent issues with excessive slipping could tarnish platform reputations if users perceive poor trade execution quality as unfair or unreliable—a concern regulators increasingly scrutinize under fair-trading standards frameworks globally.
How To Minimize Slippage Risks When Trading Crypto
To mitigate adverse effects from slippages effectively:
- Use limit orders instead of market orders whenever possible—they specify exact entry/exit points rather than accepting current best offers
- Trade during high-liquidity periods when bid-offer spreads tend narrower
- Monitor real-time order book data before placing large trades
- Employ advanced tools such as algorithmic trading bots designed explicitly for optimal timing
- Stay informed about upcoming news events that could trigger sudden volatility spikes
Implementing these practices enhances control over trade outcomes while reducing unexpected costs associated with unfavorable executions.
Understanding what causes slipage, recognizing its various forms across different order types—and actively employing risk mitigation techniques—is crucial for anyone involved in crypto trading today’s dynamic environment requires vigilance against unpredictable movements that could impact profitability significantly.
Staying informed about recent technological advancements like decentralized exchanges’ transparency features further empowers traders seeking efficient ways around common pitfalls like high-slippages while maintaining compliance amid evolving regulations ensures sustainable success over time.
免责声明:含第三方内容,非财务建议。
详见《条款和条件》
$BTC/USDT
👀 On rebondit sur le golden pocket du dernier swing low, mais le marché choppe autour de cette zone S/R avec très peu de volume.
📊 Rejet autour de $112,500 ; septembre reste historiquement bearish, mais si cette boîte tient encore quelques semaines, le bull market pourrait continuer jusqu’à la fin d’année.
💡 Opportunité réelle : surveiller la consolidation dans cette zone pour anticiper un breakout haussier ou se préparer à un pullback correctif.
👉 Es-tu prêt à prendre position avant que le marché ne tranche ?
#Bitcoin #BTC #trading #cryptocurrency #technical analysis
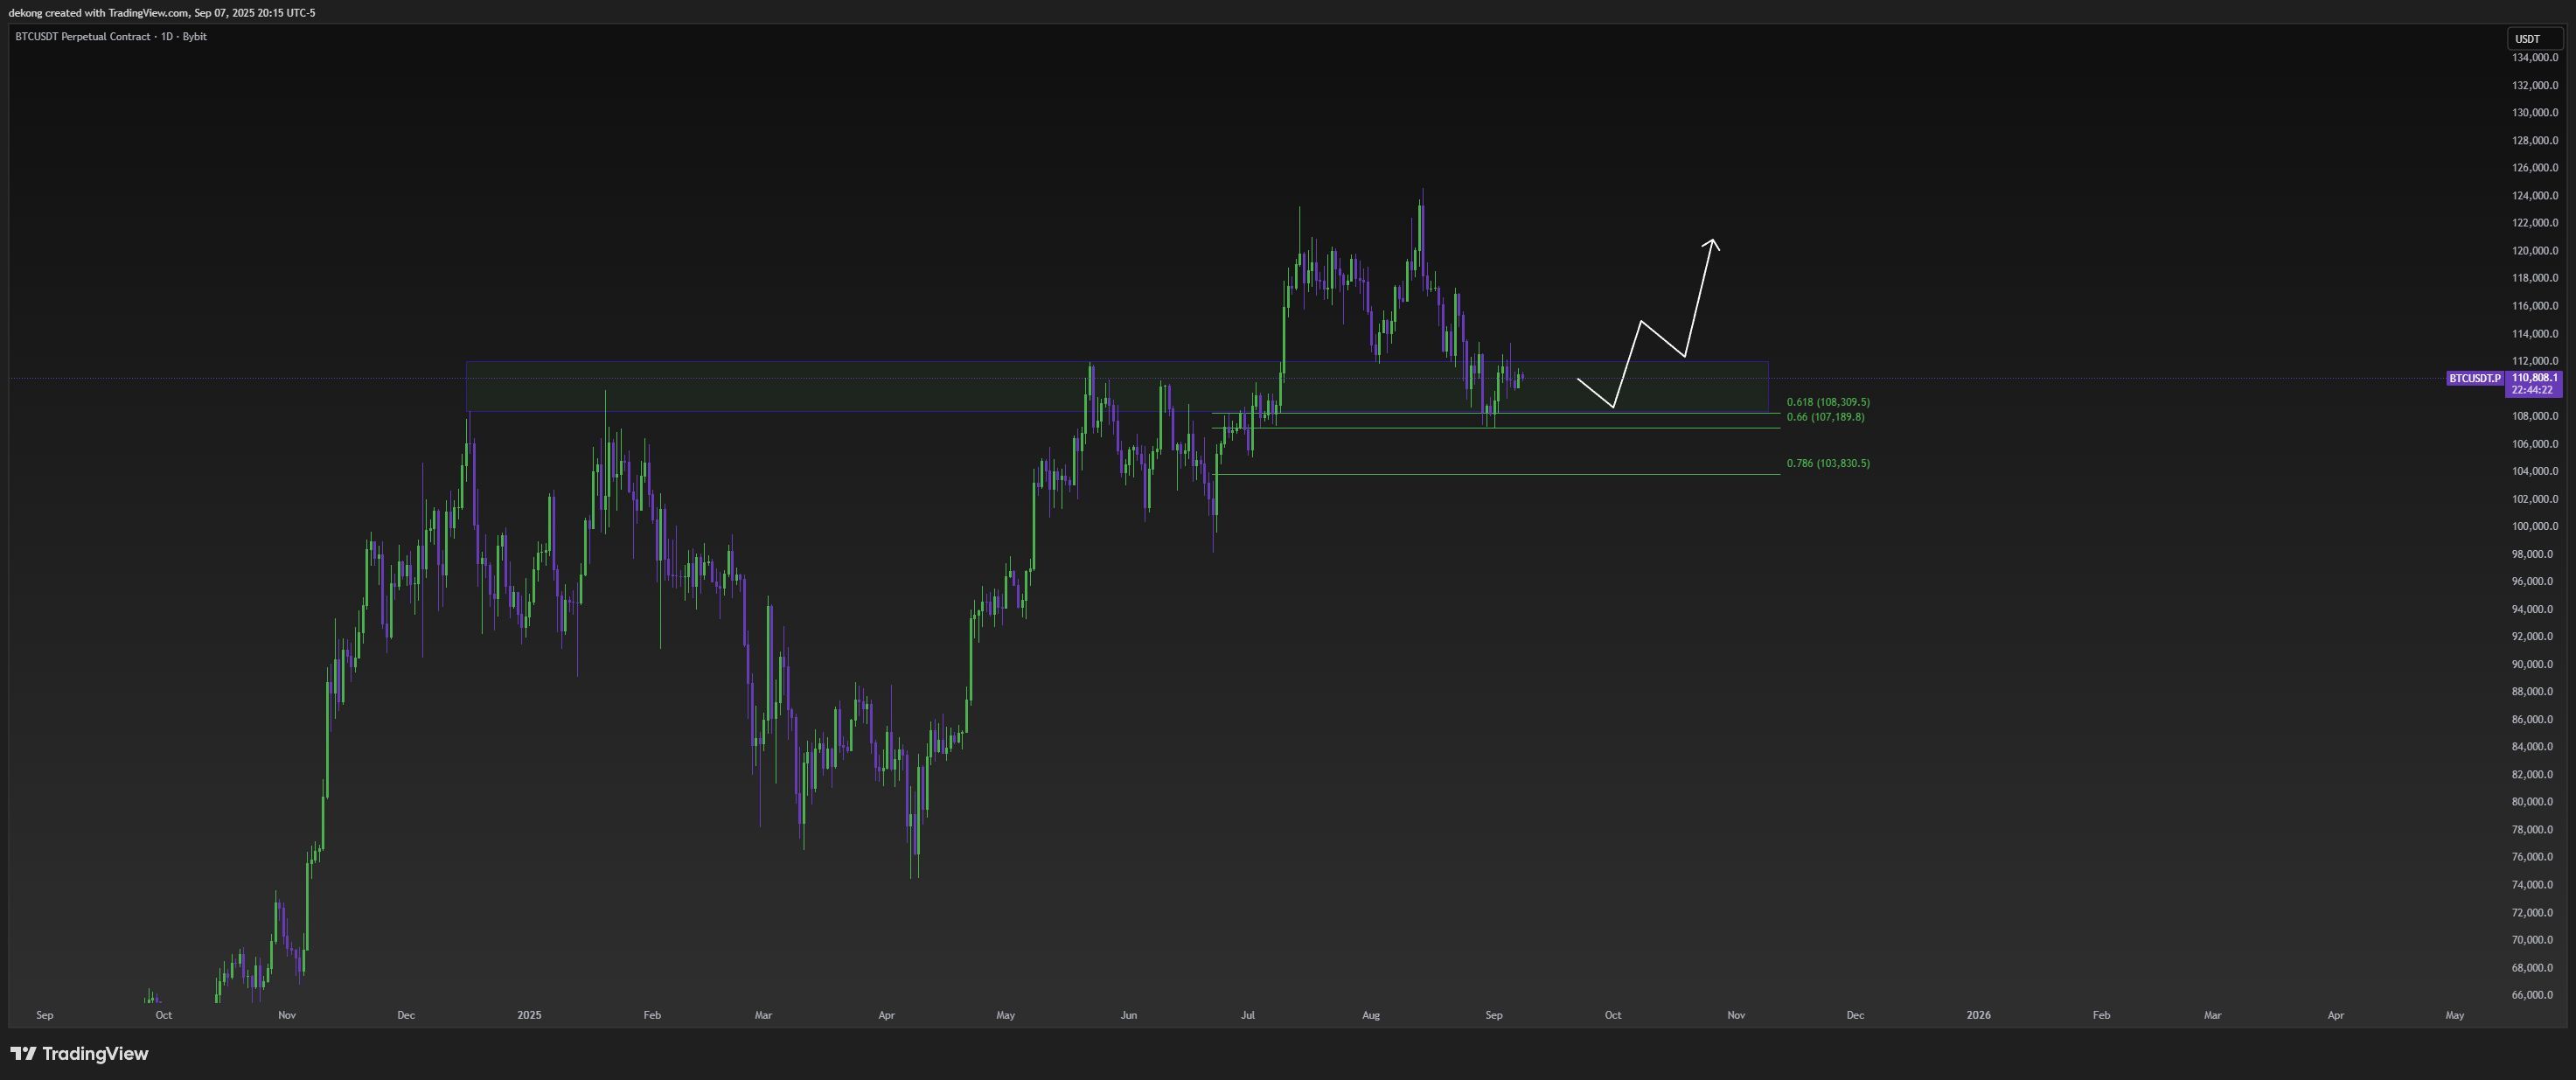

Carmelita
2025-09-08 14:03
💥 $BTC à un niveau décisif : breaker ou rebondir ?
免责声明:含第三方内容,非财务建议。
详见《条款和条件》
Features That Appeal to Advanced Traders in Crypto and Investment Markets
Understanding what attracts advanced traders is essential for anyone looking to deepen their engagement with financial markets, especially in the rapidly evolving crypto space. These traders are distinguished by their sophisticated approach, leveraging a combination of technical skills, analytical tools, and cutting-edge technology to optimize their investment strategies. Their preferences reflect a desire for precision, efficiency, and insight-driven decision-making.
Technical Analysis: The Foundation of Advanced Trading Strategies
Technical analysis remains a cornerstone for advanced traders. By studying historical price charts and identifying patterns such as head-and-shoulders or double tops/bottoms, traders can forecast potential future movements. They rely heavily on indicators like moving averages (MA), Relative Strength Index (RSI), Bollinger Bands, and Fibonacci retracements to gauge market momentum and trend strength. Mastery of these tools allows them to time entries and exits more accurately while managing risk effectively.
Moreover, advanced traders often combine multiple technical signals to confirm trading opportunities—reducing false positives—and employ chart pattern recognition alongside volume analysis for deeper insights into market sentiment.
Fundamental Analysis: Assessing Intrinsic Value
While technical analysis focuses on price action, fundamental analysis provides an understanding of an asset’s intrinsic value based on underlying factors. For cryptocurrencies or traditional assets alike, this involves scrutinizing financial statements (where applicable), management teams’ credibility in the case of tokens tied to projects or companies, industry trends influencing demand/supply dynamics, regulatory developments impacting valuation prospects—and macroeconomic conditions affecting overall market health.
Advanced investors use this comprehensive approach not only for long-term positioning but also as a filter when evaluating new investment opportunities within volatile markets like crypto where fundamentals can shift rapidly due to technological innovations or regulatory changes.
Risk Management Techniques Employed by Experienced Traders
Risk management is arguably the most critical aspect that differentiates seasoned traders from novices. Advanced practitioners implement strict stop-loss orders tailored per trade based on volatility levels; diversify across asset classes; utilize hedging instruments such as options or futures; and apply position sizing strategies aligned with their risk appetite.
Leverage management is particularly vital in crypto markets where high leverage can amplify gains but equally magnify losses if not carefully controlled. Sophisticated traders continuously monitor exposure levels through real-time dashboards—adjusting positions dynamically during sudden market swings—to protect capital against unpredictable events.
Market Sentiment Analysis: Gauging Collective Mood
Understanding how other market participants feel about an asset offers valuable context beyond raw data points. Advanced traders leverage sentiment analysis tools that scan social media platforms like Twitter or Reddit for trending discussions related to specific tokens or stocks. They also analyze news analytics platforms that aggregate headlines impacting prices instantly—helping them anticipate short-term moves driven by collective psychology rather than fundamentals alone.
Sentiment indicators such as the Fear & Greed Index provide additional layers of insight into whether markets are overly optimistic or pessimistic—a crucial factor when timing trades during periods of heightened emotional reactions which often lead to volatility spikes.
Algorithmic Trading: Automating Complex Strategies
Automation through algorithmic trading appeals strongly at an advanced level because it minimizes emotional biases inherent in manual trading decisions while increasing execution speed and accuracy. Traders develop custom algorithms using programming languages like Python or specialized platforms that execute predefined rules based on technical signals combined with real-time data feeds.
Pre-built algorithmic solutions enable backtesting strategies over historical data before deployment—ensuring robustness—and facilitate high-frequency trading (HFT) approaches where milliseconds matter—for example in arbitrage opportunities across different exchanges or rapid response during flash crashes common in crypto markets.
Blockchain-Specific Tools Enhancing Decision-Making
Crypto-specific tools are indispensable for advanced digital asset investors seeking granular insights into blockchain activity beyond price charts alone. Blockchain explorers allow users to track transaction histories at address level detail; on-chain analytics platforms provide metrics such as network hash rate fluctuations—which indicate miner activity—and token transfer volumes signaling potential accumulation phases ahead of major rallies.
Smart contract performance metrics help assess project health directly from blockchain data—crucial when investing in DeFi protocols whose success hinges upon contract security and functionality integrity—all contributing toward more informed decision-making rooted firmly within transparent blockchain ecosystems.
Artificial Intelligence & Machine Learning Integration
The adoption of AI/ML technologies has revolutionized how sophisticated investors analyze vast datasets quickly—from social media sentiment shifts to macroeconomic indicators—and generate predictive models with higher accuracy than traditional methods alone. Platforms integrating AI foundation models enhance fraud detection rates significantly—as seen with Stripe’s recent advancements—which translates well into finance sectors including crypto trading where security breaches pose serious risks.
AI-driven algorithms adapt continuously through machine learning processes that refine predictions over time—a vital feature given the fast-paced nature of modern financial markets requiring constant updates based on new information streams.
Community Engagement & Educational Resources
Advanced traders recognize the importance of staying connected within expert communities online—from forums like Reddit’s r/CryptoCurrency discussions to professional networks offering proprietary research reports—to exchange ideas about emerging trends and innovative strategies.
Educational resources—including webinars from industry leaders—or access points providing real-time alerts help refine skills continually while keeping pace with technological advancements such as DeFi innovations or regulatory shifts affecting global markets.
Recent Developments Shaping Advanced Trading Practices
The landscape continues evolving rapidly—with notable milestones including Sam Altman’s World Network raising $135 million via private token sales exemplifying growing institutional interest in blockchain projects[1]. Simultaneously, AI integration advances have improved fraud detection capabilities dramatically[2], influencing how risk mitigation is approached across all sectors—including cryptocurrency trading environments prone to manipulation risks amid high volatility.
These developments underscore why staying informed about technological breakthroughs—not just traditional analytical methods—is essential for maintaining competitive advantage among experienced investors navigating complex digital economies.
Challenges Facing Advanced Traders Today
Despite numerous advantages offered by these features—such as enhanced precision via AI-powered analytics—they face significant hurdles too:
- Regulatory Changes: As authorities craft new frameworks around cryptocurrencies and automated trading systems,[3] compliance becomes increasingly complex.
- Market Volatility: Crypto assets remain highly susceptible to sudden swings driven by macro events—or even social media rumors—which require adaptive risk controls.[4]
- Security Concerns: With increased reliance on digital infrastructure comes heightened vulnerability; safeguarding systems against hacking attempts remains paramount.[5]
By understanding these challenges alongside leveraging powerful features designed specifically for sophisticated investing approaches , advanced traders can better navigate today’s dynamic environment while maximizing returns responsibly.
References
1. Sam Altman's World Network blockchain project raises $135 million in private token sale
2. Stripe unveils AI foundation model for payments and closer fraud detection
3. Regulatory Changes in Financial Markets
4. Market Volatility: How To Manage Risks
5. Security Concerns In AI-Driven Trading Systems
kai
2025-05-26 17:23
What features appeal to advanced traders?
Features That Appeal to Advanced Traders in Crypto and Investment Markets
Understanding what attracts advanced traders is essential for anyone looking to deepen their engagement with financial markets, especially in the rapidly evolving crypto space. These traders are distinguished by their sophisticated approach, leveraging a combination of technical skills, analytical tools, and cutting-edge technology to optimize their investment strategies. Their preferences reflect a desire for precision, efficiency, and insight-driven decision-making.
Technical Analysis: The Foundation of Advanced Trading Strategies
Technical analysis remains a cornerstone for advanced traders. By studying historical price charts and identifying patterns such as head-and-shoulders or double tops/bottoms, traders can forecast potential future movements. They rely heavily on indicators like moving averages (MA), Relative Strength Index (RSI), Bollinger Bands, and Fibonacci retracements to gauge market momentum and trend strength. Mastery of these tools allows them to time entries and exits more accurately while managing risk effectively.
Moreover, advanced traders often combine multiple technical signals to confirm trading opportunities—reducing false positives—and employ chart pattern recognition alongside volume analysis for deeper insights into market sentiment.
Fundamental Analysis: Assessing Intrinsic Value
While technical analysis focuses on price action, fundamental analysis provides an understanding of an asset’s intrinsic value based on underlying factors. For cryptocurrencies or traditional assets alike, this involves scrutinizing financial statements (where applicable), management teams’ credibility in the case of tokens tied to projects or companies, industry trends influencing demand/supply dynamics, regulatory developments impacting valuation prospects—and macroeconomic conditions affecting overall market health.
Advanced investors use this comprehensive approach not only for long-term positioning but also as a filter when evaluating new investment opportunities within volatile markets like crypto where fundamentals can shift rapidly due to technological innovations or regulatory changes.
Risk Management Techniques Employed by Experienced Traders
Risk management is arguably the most critical aspect that differentiates seasoned traders from novices. Advanced practitioners implement strict stop-loss orders tailored per trade based on volatility levels; diversify across asset classes; utilize hedging instruments such as options or futures; and apply position sizing strategies aligned with their risk appetite.
Leverage management is particularly vital in crypto markets where high leverage can amplify gains but equally magnify losses if not carefully controlled. Sophisticated traders continuously monitor exposure levels through real-time dashboards—adjusting positions dynamically during sudden market swings—to protect capital against unpredictable events.
Market Sentiment Analysis: Gauging Collective Mood
Understanding how other market participants feel about an asset offers valuable context beyond raw data points. Advanced traders leverage sentiment analysis tools that scan social media platforms like Twitter or Reddit for trending discussions related to specific tokens or stocks. They also analyze news analytics platforms that aggregate headlines impacting prices instantly—helping them anticipate short-term moves driven by collective psychology rather than fundamentals alone.
Sentiment indicators such as the Fear & Greed Index provide additional layers of insight into whether markets are overly optimistic or pessimistic—a crucial factor when timing trades during periods of heightened emotional reactions which often lead to volatility spikes.
Algorithmic Trading: Automating Complex Strategies
Automation through algorithmic trading appeals strongly at an advanced level because it minimizes emotional biases inherent in manual trading decisions while increasing execution speed and accuracy. Traders develop custom algorithms using programming languages like Python or specialized platforms that execute predefined rules based on technical signals combined with real-time data feeds.
Pre-built algorithmic solutions enable backtesting strategies over historical data before deployment—ensuring robustness—and facilitate high-frequency trading (HFT) approaches where milliseconds matter—for example in arbitrage opportunities across different exchanges or rapid response during flash crashes common in crypto markets.
Blockchain-Specific Tools Enhancing Decision-Making
Crypto-specific tools are indispensable for advanced digital asset investors seeking granular insights into blockchain activity beyond price charts alone. Blockchain explorers allow users to track transaction histories at address level detail; on-chain analytics platforms provide metrics such as network hash rate fluctuations—which indicate miner activity—and token transfer volumes signaling potential accumulation phases ahead of major rallies.
Smart contract performance metrics help assess project health directly from blockchain data—crucial when investing in DeFi protocols whose success hinges upon contract security and functionality integrity—all contributing toward more informed decision-making rooted firmly within transparent blockchain ecosystems.
Artificial Intelligence & Machine Learning Integration
The adoption of AI/ML technologies has revolutionized how sophisticated investors analyze vast datasets quickly—from social media sentiment shifts to macroeconomic indicators—and generate predictive models with higher accuracy than traditional methods alone. Platforms integrating AI foundation models enhance fraud detection rates significantly—as seen with Stripe’s recent advancements—which translates well into finance sectors including crypto trading where security breaches pose serious risks.
AI-driven algorithms adapt continuously through machine learning processes that refine predictions over time—a vital feature given the fast-paced nature of modern financial markets requiring constant updates based on new information streams.
Community Engagement & Educational Resources
Advanced traders recognize the importance of staying connected within expert communities online—from forums like Reddit’s r/CryptoCurrency discussions to professional networks offering proprietary research reports—to exchange ideas about emerging trends and innovative strategies.
Educational resources—including webinars from industry leaders—or access points providing real-time alerts help refine skills continually while keeping pace with technological advancements such as DeFi innovations or regulatory shifts affecting global markets.
Recent Developments Shaping Advanced Trading Practices
The landscape continues evolving rapidly—with notable milestones including Sam Altman’s World Network raising $135 million via private token sales exemplifying growing institutional interest in blockchain projects[1]. Simultaneously, AI integration advances have improved fraud detection capabilities dramatically[2], influencing how risk mitigation is approached across all sectors—including cryptocurrency trading environments prone to manipulation risks amid high volatility.
These developments underscore why staying informed about technological breakthroughs—not just traditional analytical methods—is essential for maintaining competitive advantage among experienced investors navigating complex digital economies.
Challenges Facing Advanced Traders Today
Despite numerous advantages offered by these features—such as enhanced precision via AI-powered analytics—they face significant hurdles too:
- Regulatory Changes: As authorities craft new frameworks around cryptocurrencies and automated trading systems,[3] compliance becomes increasingly complex.
- Market Volatility: Crypto assets remain highly susceptible to sudden swings driven by macro events—or even social media rumors—which require adaptive risk controls.[4]
- Security Concerns: With increased reliance on digital infrastructure comes heightened vulnerability; safeguarding systems against hacking attempts remains paramount.[5]
By understanding these challenges alongside leveraging powerful features designed specifically for sophisticated investing approaches , advanced traders can better navigate today’s dynamic environment while maximizing returns responsibly.
References
1. Sam Altman's World Network blockchain project raises $135 million in private token sale
2. Stripe unveils AI foundation model for payments and closer fraud detection
3. Regulatory Changes in Financial Markets
4. Market Volatility: How To Manage Risks
5. Security Concerns In AI-Driven Trading Systems
免责声明:含第三方内容,非财务建议。
详见《条款和条件》
How to Generate a Trading Signal Using a MACD Crossover
Understanding how to effectively generate trading signals is crucial for traders aiming to capitalize on market movements. Among various technical indicators, the MACD (Moving Average Convergence Divergence) crossover stands out as a popular and reliable method for identifying potential buy and sell opportunities. This article provides a comprehensive guide on how to generate trading signals using MACD crossovers, emphasizing practical application, key considerations, and best practices.
What Is a MACD Crossover?
A MACD crossover occurs when the MACD line crosses above or below its signal line. The MACD indicator itself is derived from two exponential moving averages (EMAs): typically the 12-period EMA (fast) and the 26-period EMA (slow). The difference between these EMAs forms the MACD line. To smooth out short-term fluctuations and provide clearer signals, traders use a 9-period EMA of this line called the signal line.
When analyzing charts, traders look for points where these two lines intersect. These intersections are interpreted as potential shifts in market momentum—either bullish or bearish—forming the basis of trading signals.
How Does a MACD Crossover Signal Work?
The core principle behind generating trading signals with MACD crossovers lies in trend confirmation:
Bullish Signal: When the MACD line crosses above its signal line, it suggests that short-term momentum is gaining relative to longer-term trends. This crossover indicates increasing buying pressure and can be seen as an opportunity to enter long positions.
Bearish Signal: Conversely, when the MACD line crosses below its signal line, it signifies waning upward momentum or increasing downward pressure—potentially signaling an optimal point to sell or short-sell.
These crossovers serve as early indicators of trend reversals or continuations but should not be used in isolation due to their susceptibility to false signals during volatile markets.
Step-by-Step Process for Generating Trading Signals
To effectively utilize macd crossovers in your trading strategy, follow these steps:
Set Up Your Chart: Apply the standard MACD indicator with default parameters—12-day fast EMA, 26-day slow EMA—and set your chart timeframe based on your trading style (intraday, swing trade, etc.).
Identify Crossovers:
- Look for points where the blue/macd line intersects with the red/signal line.
- A crossover from below indicates bullish momentum; from above indicates bearish momentum.
Confirm Trend Direction:
- Use additional tools such as volume analysis or other indicators like RSI (Relative Strength Index) or Bollinger Bands.
- Confirm whether broader market conditions support your trade idea before acting on crossover signals.
Enter Trades Based on Crossovers:
- Enter long positions immediately after bullish crossovers confirmed by other factors.
- Enter short positions following bearish crossovers once confirmed by complementary analysis.
Set Stop-Losses & Take-Profit Levels:
- Protect yourself against false signals by placing stop-loss orders just beyond recent support/resistance levels.
- Define profit targets aligned with your risk-reward ratio.
Monitor Market Conditions Continuously:
- Be aware that frequent volatility can cause multiple false crossovers; avoid overtrading based solely on this indicator.
Use Additional Confirmation Tools: Incorporate other technical indicators like RSI divergence or volume spikes for more reliable entry/exit points.
Practical Tips for Effective Use of Macd Crossovers
While generating trades through macd crossovers can be straightforward, several best practices enhance success rates:
Avoid Relying Solely on One Indicator: Combining macd with other tools reduces false positives caused by market noise.
Pay Attention to Market Context: During highly volatile periods like earnings reports or macroeconomic releases, interpret crossings cautiously—they may not reflect true trend changes.
Adjust Parameters if Needed: Some traders customize EMAs’ periods based on specific assets’ behavior; experimentation can improve accuracy but stick close to standard settings initially until you gain experience.
Observe Divergences: Bullish/bearish divergences between price action and macd lines often precede significant reversals—they are valuable supplementary signs alongside crossings.
Recognizing False Signals and Managing Risks
One common challenge when using macd crossovers is dealing with false positives—signals that do not lead to sustained price movements:
During sideways markets without clear trends,macd crossings may occur frequently without meaningful follow-through—a phenomenon known as whipsawing.
To mitigate this risk:
- Wait for confirmation from higher timeframes
- Use filters such as volume increases
- Combine with trend-following tools like moving averages
Proper risk management strategies—including setting appropriate stop-loss levels—is essential when relying on any technical indicator.
Incorporating Macd Crosses into Broader Trading Strategies
Successful traders often integrate macd crossover signals within comprehensive strategies that include fundamental analysis and multiple technical tools:
For example,combining macd buy/sell triggers with RSI oversold/overbought conditions enhances decision-making accuracy.
Algorithmic traders leverage automated systems programmed to execute trades upon specific crossing criteria combined with predefined filters—for faster reaction times especially relevant in crypto markets where volatility is high.
Final Thoughts: Using Macd Crossings Effectively
Generating accurate trading signals through macd crossings requires understanding their mechanics alongside disciplined execution practices:
- Always confirm crossing-based entries with additional analysis
- Adjust parameters thoughtfully according to asset behavior
- Maintain strict risk controls against false alarms
By doing so—and continuously refining your approach—you can harness this powerful tool within your overall trading framework effectively while managing inherent risks associated with technical analysis methods.
Keywords & Semantic Terms Used
MACD crossover | Trading signal | Technical analysis | Moving averages | Bullish/bearish signal | Trend confirmation | False signals | Risk management | Crypto markets | Automated trading
Lo
2025-05-09 04:22
How do you generate a trading signal using a MACD crossover?
How to Generate a Trading Signal Using a MACD Crossover
Understanding how to effectively generate trading signals is crucial for traders aiming to capitalize on market movements. Among various technical indicators, the MACD (Moving Average Convergence Divergence) crossover stands out as a popular and reliable method for identifying potential buy and sell opportunities. This article provides a comprehensive guide on how to generate trading signals using MACD crossovers, emphasizing practical application, key considerations, and best practices.
What Is a MACD Crossover?
A MACD crossover occurs when the MACD line crosses above or below its signal line. The MACD indicator itself is derived from two exponential moving averages (EMAs): typically the 12-period EMA (fast) and the 26-period EMA (slow). The difference between these EMAs forms the MACD line. To smooth out short-term fluctuations and provide clearer signals, traders use a 9-period EMA of this line called the signal line.
When analyzing charts, traders look for points where these two lines intersect. These intersections are interpreted as potential shifts in market momentum—either bullish or bearish—forming the basis of trading signals.
How Does a MACD Crossover Signal Work?
The core principle behind generating trading signals with MACD crossovers lies in trend confirmation:
Bullish Signal: When the MACD line crosses above its signal line, it suggests that short-term momentum is gaining relative to longer-term trends. This crossover indicates increasing buying pressure and can be seen as an opportunity to enter long positions.
Bearish Signal: Conversely, when the MACD line crosses below its signal line, it signifies waning upward momentum or increasing downward pressure—potentially signaling an optimal point to sell or short-sell.
These crossovers serve as early indicators of trend reversals or continuations but should not be used in isolation due to their susceptibility to false signals during volatile markets.
Step-by-Step Process for Generating Trading Signals
To effectively utilize macd crossovers in your trading strategy, follow these steps:
Set Up Your Chart: Apply the standard MACD indicator with default parameters—12-day fast EMA, 26-day slow EMA—and set your chart timeframe based on your trading style (intraday, swing trade, etc.).
Identify Crossovers:
- Look for points where the blue/macd line intersects with the red/signal line.
- A crossover from below indicates bullish momentum; from above indicates bearish momentum.
Confirm Trend Direction:
- Use additional tools such as volume analysis or other indicators like RSI (Relative Strength Index) or Bollinger Bands.
- Confirm whether broader market conditions support your trade idea before acting on crossover signals.
Enter Trades Based on Crossovers:
- Enter long positions immediately after bullish crossovers confirmed by other factors.
- Enter short positions following bearish crossovers once confirmed by complementary analysis.
Set Stop-Losses & Take-Profit Levels:
- Protect yourself against false signals by placing stop-loss orders just beyond recent support/resistance levels.
- Define profit targets aligned with your risk-reward ratio.
Monitor Market Conditions Continuously:
- Be aware that frequent volatility can cause multiple false crossovers; avoid overtrading based solely on this indicator.
Use Additional Confirmation Tools: Incorporate other technical indicators like RSI divergence or volume spikes for more reliable entry/exit points.
Practical Tips for Effective Use of Macd Crossovers
While generating trades through macd crossovers can be straightforward, several best practices enhance success rates:
Avoid Relying Solely on One Indicator: Combining macd with other tools reduces false positives caused by market noise.
Pay Attention to Market Context: During highly volatile periods like earnings reports or macroeconomic releases, interpret crossings cautiously—they may not reflect true trend changes.
Adjust Parameters if Needed: Some traders customize EMAs’ periods based on specific assets’ behavior; experimentation can improve accuracy but stick close to standard settings initially until you gain experience.
Observe Divergences: Bullish/bearish divergences between price action and macd lines often precede significant reversals—they are valuable supplementary signs alongside crossings.
Recognizing False Signals and Managing Risks
One common challenge when using macd crossovers is dealing with false positives—signals that do not lead to sustained price movements:
During sideways markets without clear trends,macd crossings may occur frequently without meaningful follow-through—a phenomenon known as whipsawing.
To mitigate this risk:
- Wait for confirmation from higher timeframes
- Use filters such as volume increases
- Combine with trend-following tools like moving averages
Proper risk management strategies—including setting appropriate stop-loss levels—is essential when relying on any technical indicator.
Incorporating Macd Crosses into Broader Trading Strategies
Successful traders often integrate macd crossover signals within comprehensive strategies that include fundamental analysis and multiple technical tools:
For example,combining macd buy/sell triggers with RSI oversold/overbought conditions enhances decision-making accuracy.
Algorithmic traders leverage automated systems programmed to execute trades upon specific crossing criteria combined with predefined filters—for faster reaction times especially relevant in crypto markets where volatility is high.
Final Thoughts: Using Macd Crossings Effectively
Generating accurate trading signals through macd crossings requires understanding their mechanics alongside disciplined execution practices:
- Always confirm crossing-based entries with additional analysis
- Adjust parameters thoughtfully according to asset behavior
- Maintain strict risk controls against false alarms
By doing so—and continuously refining your approach—you can harness this powerful tool within your overall trading framework effectively while managing inherent risks associated with technical analysis methods.
Keywords & Semantic Terms Used
MACD crossover | Trading signal | Technical analysis | Moving averages | Bullish/bearish signal | Trend confirmation | False signals | Risk management | Crypto markets | Automated trading
免责声明:含第三方内容,非财务建议。
详见《条款和条件》