Winter Solstice is here
Treat yourself to something warm. Keep warm. Stay grounded. Ju.com is with you.
#Jucom


JU Blog
2025-12-21 07:19
Winter Solstice is here
免责声明:含第三方内容,非财务建议。
详见《条款和条件》

To seize the global opportunities brought about by the rapid development of artificial intelligence (AI) technology and to further promote the deep integration of cutting-edge technology with the real economy and the digital economy, Ju.com officially announces the establishment of a $30 million AI special investment fund.
This fund will systematically invest around core AI technologies and the next generation of intelligent product forms. Key investment areas include, but are not limited to: • AI foundational models and underlying technologies • AI Agent products and solutions, encompassing autonomous decision-making, task execution, and automation scenarios • Intelligent robotics-related products, including software-driven robots, Embodied AI, and human-robot collaboration systems • Convergent applications of AI and Blockchain / Web3, such as smart contract automation, on-chain governance and risk control, and decentralized intelligent execution systems • Commercialization and implementation of AI in fields like fintech, enterprise services, content generation, and data analytics
This special fund will invite several listed companies and industrial capital to co-invest. By leveraging synergies from industrial resources, application scenarios, and financial support, it aims to provide portfolio projects with full-cycle empowerment, from technology validation and commercial implementation to long-term strategic partnerships.
Ju.com has always adhered to a long-term value and technological innovation-oriented approach, continuously building an open, robust, and sustainable technology investment ecosystem. The establishment of this AI special fund represents a crucial strategic move by Ju.com in the context of cutting-edge technology and the intelligent trend, and also reflects our high recognition of the long-term industrial value of AI, AI Agent, and robotics technologies.
In the future, Ju.com will collaborate with outstanding entrepreneurial teams, technical talent, and industrial partners worldwide to jointly promote the large-scale application and industrial upgrading of the next generation of intelligent products.
This is hereby announced.
#AI #Jucom

On February 11, the crypto market extended its pullback, with total market capitalization declining to $255 billion. The Fear & Greed Index ticked slightly higher to 11, yet remains firmly within extreme fear territory. Sentiment continues to be fragile, and risk appetite remains constrained.
Bitcoin fell 1.94% to $69,169.44, trading between $67,883.0 and $70,499.9 during the session. Long positions account for 49.67%, while shorts stand at 50.33%, with the aggregate long–short ratio rising to 1.83. This suggests selective positioning for a bounce at lower levels, though the broader structure still leans defensive. With BTC slipping below the $70,000 threshold, debate around whether $60,000 could represent a cyclical bottom has intensified.
Ethereum experienced sharper pressure, dropping 4.37% to $2,024.84, after briefly touching $1,983.77 intraday. Compared with Bitcoin, ETH displayed greater downside sensitivity, reflecting the market’s tendency to reduce exposure to higher-beta assets during risk contraction phases.
Among outperformers, PIPPIN, RIVER, and FHE posted notable gains, largely driven by short-term tactical positioning rather than a broad improvement in sentiment.
Narrative focus shifted toward structural and macro themes. Grayscale raised the question of whether $60,000 may serve as a cyclical base for Bitcoin, prompting renewed discussions on strategic positioning. Progress and disagreements surrounding the CLARITY Act remain a key regulatory variable in the United States. Meanwhile, Vitalik Buterin’s vision for Ethereum’s integration with AI highlights longer-term innovation pathways beyond current volatility. The Federal Reserve’s influence over interest rates continues to shape broader economic expectations, leaving markets attentive to future liquidity signals.
Overall, February 11 reflects a phase of continued fear with moderating selling intensity. While a decisive reversal has yet to emerge, downside momentum appears to be narrowing. In the absence of clearer macro or regulatory catalysts, markets are likely to remain range-bound near recent lows as participants search for a more durable base.
#cryptocurrency #blockchain #technical analysis #JU #Jucom
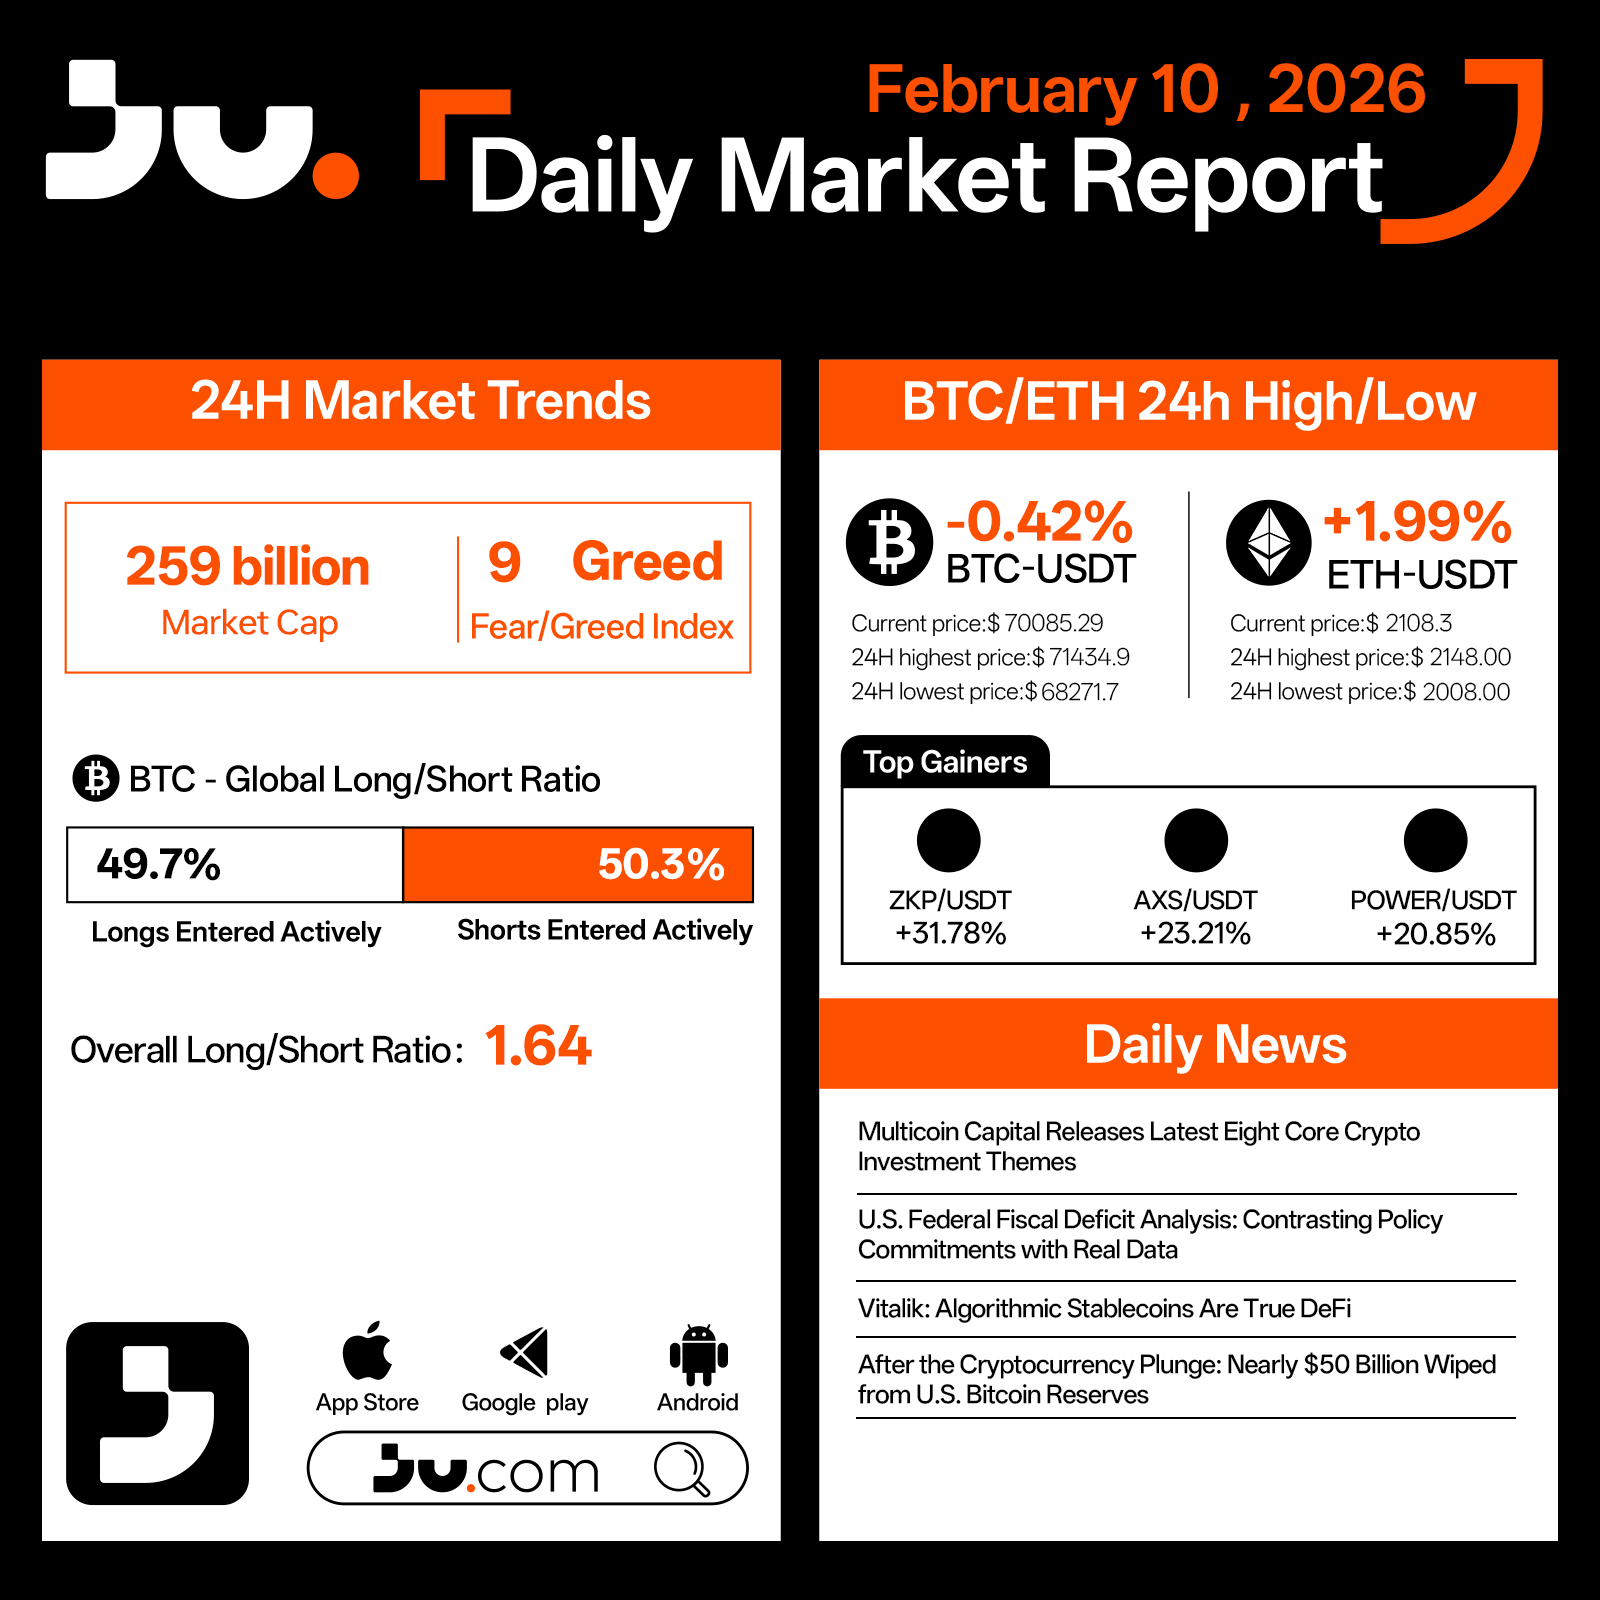
On February 10, the crypto market continued to trade within extreme fear territory, with total market capitalization holding at $259 billion and the Fear & Greed Index slipping further to 9. While sentiment remains deeply risk-averse, the pace of downside acceleration has clearly slowed compared with last week’s sell-off.
Bitcoin edged down 0.42% to $70,085.29, fluctuating between $68,271.7 and $71,434.9 throughout the session. Positioning data shows longs at 49.7% versus shorts at 50.3%, with the aggregate long–short ratio falling to 1.64. This reflects continued deleveraging and shrinking speculative exposure, suggesting the market is transitioning from a high-volatility liquidation phase to a low-leverage consolidation period.
Ethereum showed relative resilience, gaining 1.99% to $2,108.30 after briefly dipping to $2,008 before rebounding. This divergence indicates selective dip-buying in core assets even as overall risk appetite remains constrained.
Among smaller-cap tokens, ZKP, AXS, and POWER led gains, driven largely by short-term positioning and tactical rebounds rather than a broad-based improvement in sentiment. Market dynamics remain characterized by selective recovery rather than a full risk-on rotation.
Narrative focus continues to shift away from price action toward structural and long-term considerations. Variant’s reflections on insider trading in prediction markets highlight governance and transparency challenges in decentralized platforms. a16z reiterated its long-term philosophy for crypto, emphasizing that cyclical drawdowns do not negate the structural trajectory of the industry. At the same time, Goldman Sachs’ evolving crypto strategy and renewed discussion around the strategic role of gold underscore how digital assets and traditional safe havens are increasingly evaluated within the same macro allocation framework.
Overall, February 10 reflects a phase of late-stage fear and tentative stabilization. While selling pressure has eased, confidence remains fragile. Without clearer signals from liquidity conditions, macro policy, or regulation, the market is likely to remain range-bound near the lows as it searches for a durable base.
#JU #Jucom #cryptocurrency #blockchain #technical analysis
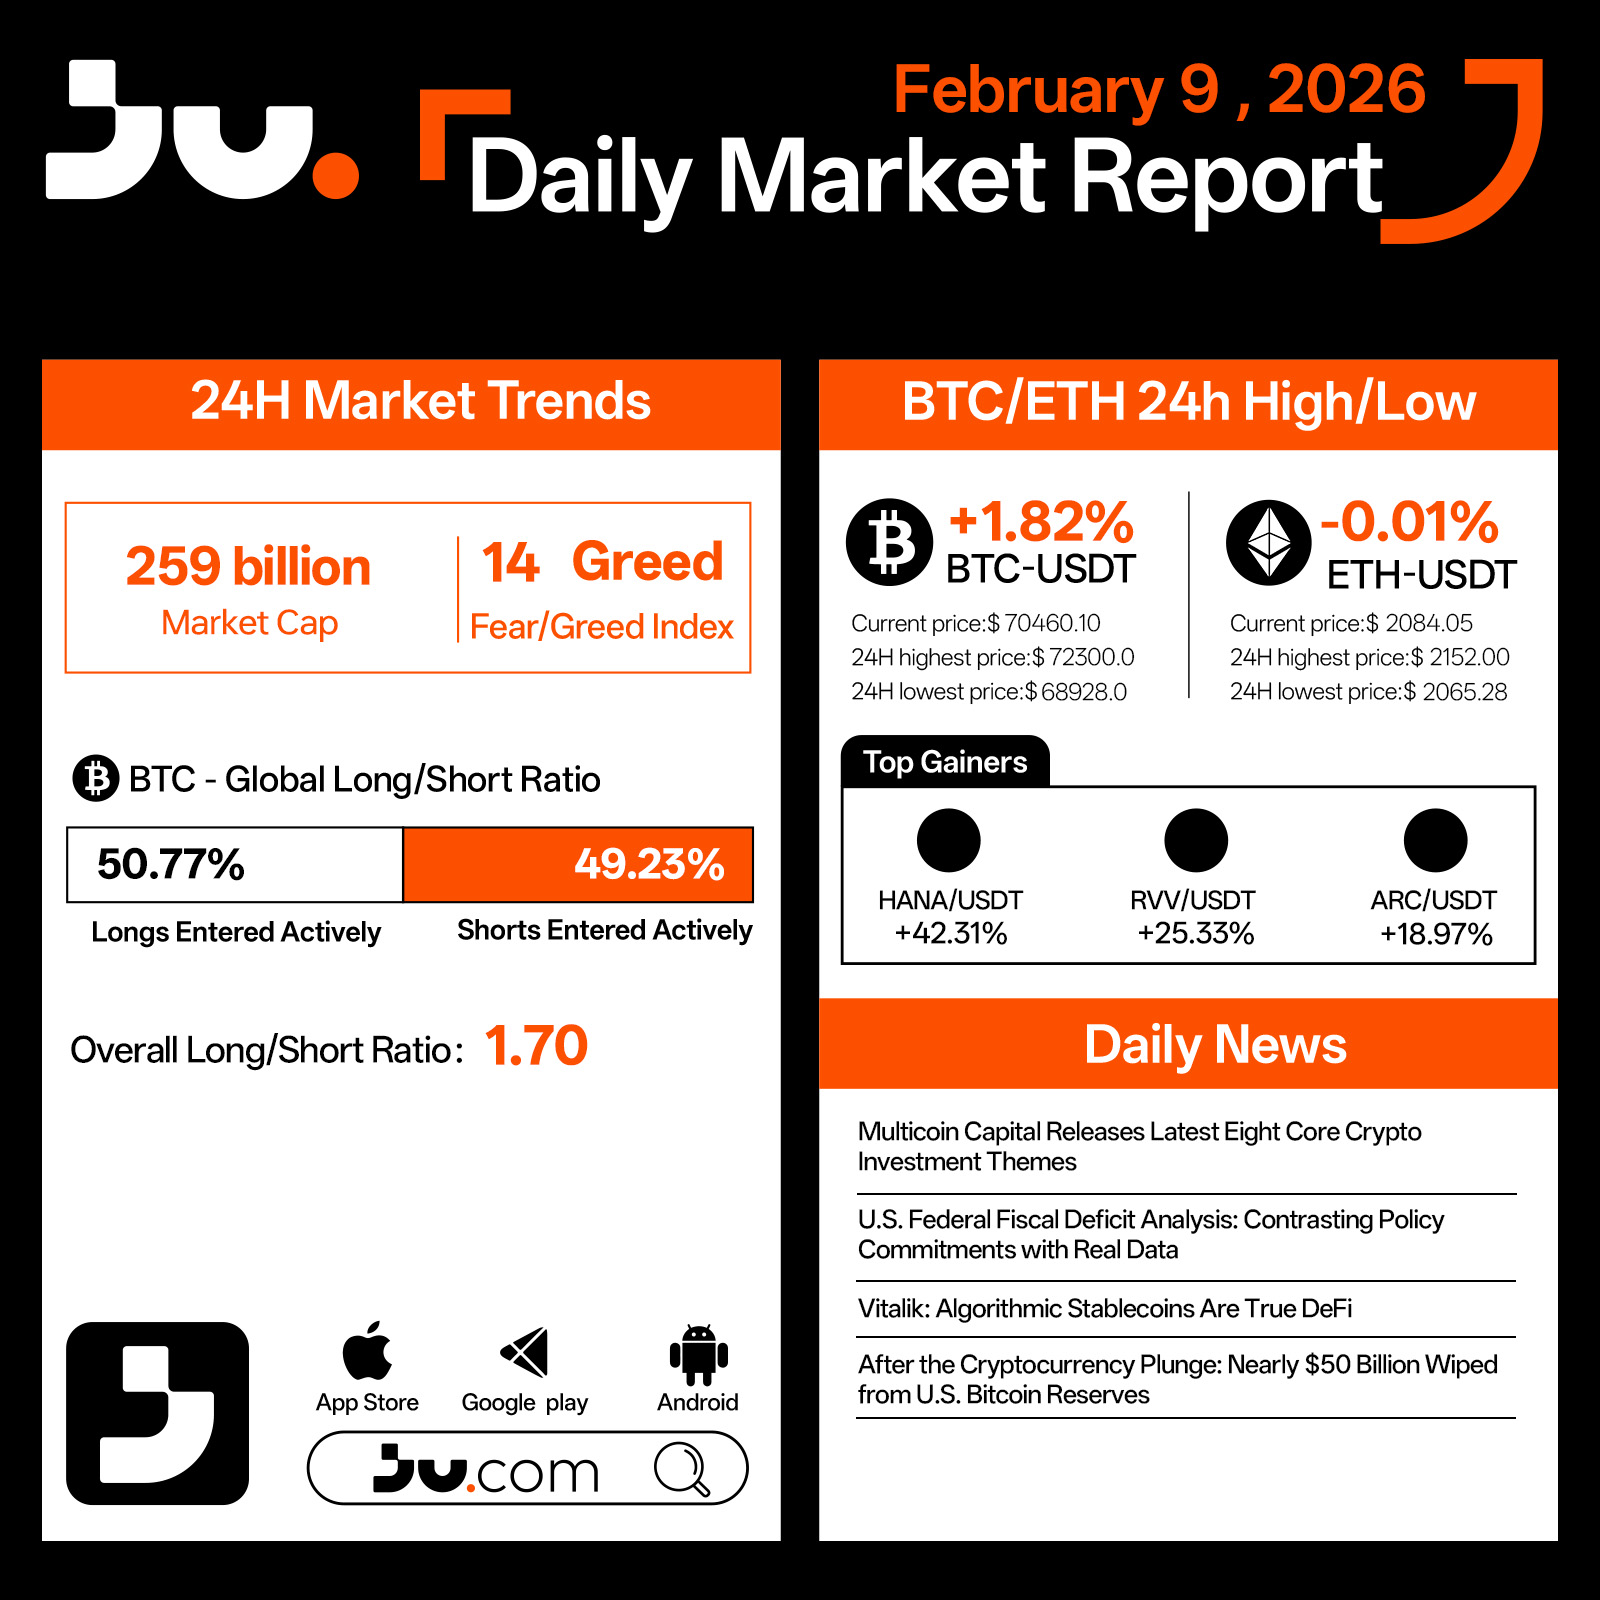
On February 9, the crypto market staged a modest rebound following the recent wave of extreme panic. Total market capitalization recovered to $259 billion, while the Fear & Greed Index remained depressed at 14, indicating that sentiment is still cautious even as selling pressure begins to ease.
Bitcoin rose 1.82% to $70,460.10, trading within a $68,928–$72,300 range. After last week’s aggressive deleveraging, downside momentum has clearly slowed. Positioning data shows BTC long exposure edging up to 50.77%, but with the aggregate long–short ratio at just 1.70, the move appears driven primarily by short covering and tentative dip-buying rather than conviction-based inflows. Ethereum lagged the rebound, finishing nearly flat at $2,084.05, underscoring continued weakness in higher-beta assets while risk appetite remains fragile.
Among smaller-cap tokens, names such as PIPPIN, RVV, and ARCU posted outsized gains, reflecting opportunistic trading in a liquidity recovery phase rather than a broad-based improvement in market sentiment.
From a narrative perspective, attention is shifting from post-crash blame to structural reflection. Multicoin Capital’s release of eight core crypto investment themes offers a refreshed framework for long-term positioning, while renewed scrutiny of the U.S. federal fiscal deficit highlights the growing gap between policy commitments and fiscal reality. Vitalik’s assertion that algorithmic stablecoins represent “true DeFi” has also resurfaced, prompting deeper discussion about the fundamental direction of decentralized finance.
Notably, following the recent sell-off, nearly $5 billion was wiped from U.S. Bitcoin reserves, reinforcing the idea that crypto assets are now intertwined with macro balance sheets rather than isolated from them.
Overall, February 9 appears to mark a technical rebound after extreme fear, not a confirmed trend reversal. While prices have stabilized, true recovery will depend on further deleveraging, improving liquidity conditions, and clearer macro signals. Until then, the market is likely to remain range-bound and fragile as it searches for a new equilibrium.
#cryptocurrency #blockchain #technical analysis #JU #Jucom
Bitcoin bags are getting blown out today, as the price of BTC falls to nearly $80,000 and marks a new seven-month low.
- The continued downward pressure on its price has pushed Bitcoin into a so-called death cross—when the average price of an asset over the short term falls below the average price over the long term. It’s a technical pattern that typically signals extended bearish momentum. For traders who study charts, it confirms what permabulls don’t want to hear: It’s over—at least for now.
- It’s happening as the crypto market as a whole shrinks to $2.91 trillion, shedding nearly $60 billion in the past 24 hours alone. Almost every single coin in the top 100 by market cap is bleeding red.
- The Fear and Greed Index, which measures market sentiment on a scale from 0 to 100, has cratered to 14 points—just four points above the year's low of 10 back in February. When this index drops below 20, it signals "extreme fear," and right now, traders are absolutely terrified.
- But it's not just crypto drama driving the market selloff. The macro picture is turning nasty. Just weeks ago, markets were pricing in a 97% chance the Federal Reserve would cut interest rates in December. Now? Those odds have collapsed to somewhere between 22% and 43%, depending on which metric you check.
- Fed officials are openly divided, with many signaling they'd prefer to keep rates unchanged through year-end. For risk assets like crypto that thrive on easy money, this is poison.
- On Myriad, a prediction market developed by Decrypt’s parent company Dastan, traders are now overwhelmingly convinced that Bitcoin will not mark a new all-time high this year, placing odds at almost 90% that BTC will not top the $126K mark that it hit on October 6.
- The bearish vibes are so strong, Myriad traders also currently place 40% odds that Bitcoin falls as low as $69K. So how low will it go? Here’s what the charts say.
- Bitcoin opened today at $86,691 and immediately sold off, hitting an intraday low of $80,620 before bouncing slightly to its current price at $85,187. That's a 1.61% drop on the day after being almost 5% down over the last 24 hours. More importantly, for traders, it further confirms the death cross pattern that's been progressively forming since its all-time high in early October. The death cross pattern was first confirmed on Wednesday as Bitcoin slid to around $88,000—now it’s fallen deeper.
- Here's what's happening on the charts: Exponential Moving Averages, or EMAs, help traders identify trend direction by tracking the average price of an asset over the short, medium, and long term. When the short-term 50-day EMA falls below the longer-term 200-day EMA, it means bears are in control and the longer-term bull market structure has been broken.
- For Bitcoin, the 50-day EMA has now decisively crossed below the 200-day EMA. In short, this tells traders market momentum has shifted from bullish to bearish. The gap between both EMAs increases the more the price of BTC trades below those targets—and the bigger the gap, the stronger the trend.
- The price of Bitcoin is now trading well below both EMAs, which creates a situation where each bounce attempt faces immediate resistance, increasing the gap between the two EMAs, making the bearish trend even stronger. Bulls trying to push higher will need to first reclaim the 50-day EMA, then tackle the 200-day—a double wall of resistance that's historically tough to crack in one go.
- As for other technical indicators, the Average Directional Index, or ADX, sits at 41, which is considered "strong." ADX measures trend strength regardless of direction, with readings above 25 indicating a clear trend is in place. At 41, this tells us we’re not seeing just a minor correction, but a potentially extended move lower.
- The Relative Strength Index, or RSI, has plunged to 23.18, placing Bitcoin deep in oversold territory. RSI measures momentum on a scale from 0 to 100, with readings below 30 signaling oversold conditions where assets are potentially undervalued. However, "oversold" doesn't mean the selling has to stop—in strong downtrends, RSI can remain in oversold territory for extended periods as prices continue grinding lower. But, yes, this also provides hopium for momentum traders as it signals that the worst of it may be over. (The worst being an accelerated crash, not necessarily a steady drop.)
- The Squeeze Momentum Indicator is flashing "bearish impulse," meaning selling pressure is intensifying rather than easing. Meanwhile, the Volume Profile Visible Range (VPVP) shows the price of Bitcoin trading "below" key volume nodes, suggesting there's not much buying interest at current levels.
- So, everything is bearish, clearly. But where's the next support? How low can the price of BTC go? The chart reveals several key horizontal levels to watch.
- The immediate danger zone is $80,697, which briefly held today but looked shaky. If that breaks, the next major support sits at $74,555, followed by $65,727, and potentially all the way down to $53,059 if panic really sets in during a crypto winter. Those price levels have previous consolidation zones where significant trading volume accumulated, making them natural landing spots for oversold bounces.
- For resistances, traders will watch for BTC’s price breaking past $90,000 again and look at $100,000 as the major psychological target.
- Ethereum opened at $2,830.7 and dropped as low as $2,621 intraday before stabilizing around $2,798—a 1.16% loss on the day. While not as dramatic as Bitcoin's selloff, ETH's technical picture is equally concerning.
- Unlike Bitcoin, Ethereum hasn't fully confirmed its death cross yet—the 50-day EMA is still technically above the 200-day, giving it a "long" signal on an indicator that is obviously hours away from changing to bearish. The gap is razor-thin and closing fast. More importantly, ETH’s price is trading well below both EMAs, rendering that technical distinction somewhat meaningless. The bearish momentum is clearly established.
- A good way to see the natural support zones is using the Fibonacci retracements: a set of natural clusters that appear during a trend, showing supports and resistances in a specific timeframe—not because of price, but because of natural proportions.
- Right now, ETH is testing the 0.618 Fibonacci level at approximately $2,755. If this level breaks, the next Fibonacci support doesn't appear until $2,180, which would represent a massive 22% drop from current prices, and would resolve a price market on Myriad betting on ETH’s moon or doom.
- The ADX for Ethereum is even stronger than Bitcoin's at 46, indicating the downtrend is rock-solid. Meanwhile, RSI sits at 28.46—not quite as oversold as Bitcoin but definitely in stressed territory. The Squeeze Momentum Indicator shows "bearish impulse" here too, confirming sellers are in control.
- XRP is showing relative strength compared to its larger peers, down just 0.50% to close at $1.98 after opening at $1.99 and hitting an intraday low of $1.81796. Don't let that modest percentage fool you though—the technical damage is real.
- Like Bitcoin, the Ripple-linked XRP has confirmed a full death cross with its 50-day EMA now below the 200-day. The price of XRP is trading beneath both EMAs, and with an ADX of 32, the downtrend has enough strength to continue. While 32 isn't as extreme as Bitcoin's 41 or Ethereum's 46, it's still well above the 25 threshold that confirms a trend is in place rather than just random chop.
- The RSI at 32.86 shows XRP is approaching oversold territory but hasn't quite reached the extreme stress levels of Bitcoin and Ethereum. This could mean two things: either XRP has more downside before finding equilibrium, or it's showing genuine relative strength that could make it a safer harbor if the broader market continues tanking.
- XRP had such a crazy year that its price action shows only two major horizontal support levels that should concern XRP holders—and that would be very painful for hodlers, considering the movement from the all-time high to those targets.
- The next major support zone sits at $1.589, which represents a potential 20% drop from current levels. If that breaks, there's very little support until $0.66, a catastrophic 67% plunge from current prices and almost 80% from all-time high zone that would take XRP back to early 2024 levels.
The Squeeze Momentum Indicator is showing "bearish impulse," and like the other coins, the volume profile indicates XRP’s price is trading below key volume levels, meaning there's not much buying interest stepping in to defend current prices.
#Bitcoin #BitcoinDeathCross #Jucom #cryptocurrency #blockchain $BTC/USDT $JU/USDT $ETH/USDT
While discussions are growing that Bitcoin-focused company Strategy (formerly MicroStrategy) could be removed from MSCI indices, the company’s chairman, Michael Saylor, maintained that the operating model is robust and that this possibility will not affect the company’s roadmap.
- MSCI has proposed removing “digital asset treasury companies” whose portfolios consist largely of cryptocurrencies from its indexes. While it noted that such companies “may exhibit characteristics similar to mutual funds,” it stated that these structures are not suitable for the indexes. The final decision will be announced on January 15th.
- In his latest post, Saylor explained that Strategy is an operating company. He pointed out that, in addition to its Bitcoin reserves, it also has a $500 million enterprise software division that has been serving corporations and public institutions for over 20 years.
- Saylor stated, “We understand that index providers periodically review their methodologies, but Strategy is not an ETF, it is not a closed-end fund, and it is certainly not a passive proxy for Bitcoin. We produce, operate, and grow just like any other business.” He added that inclusion or removal from the index would not change the company's strategy, operations, or long-term belief in BTC.
- JPMorgan issued a note this week warning that Strategy's removal from the index could lead to billions of dollars in passive outflows. Analysts estimate that a potential removal from MSCI could lead to a $2.8 billion outflow from passive funds. Overall, approximately $9 billion of Strategy's market capitalization is estimated to be tied to passive, index-tracking ETFs and mutual funds.
The sharp decline in Bitcoin's price is also putting pressure on Strategy shares, which have lost nearly 40% of their value this year.
#Bitcoin #MicroStrategy #MichaelSaylor #Jucom #cryptocurrency $BTC/USDT $JU/USDT $ETH/USDT